Line Chart Examples

Line Graph

What Is a Line Chart

 Basic Line Graphs
This solution extends the capabilities of ConceptDraw DIAGRAM (or later) with templates, samples and a library of vector stencils for drawing Line Graphs.
Concept Maps

Biology Drawing

Beauty in nature Illustrations and Clipart

Biology Drawing Software

Basic Diagramming Flowchart Software

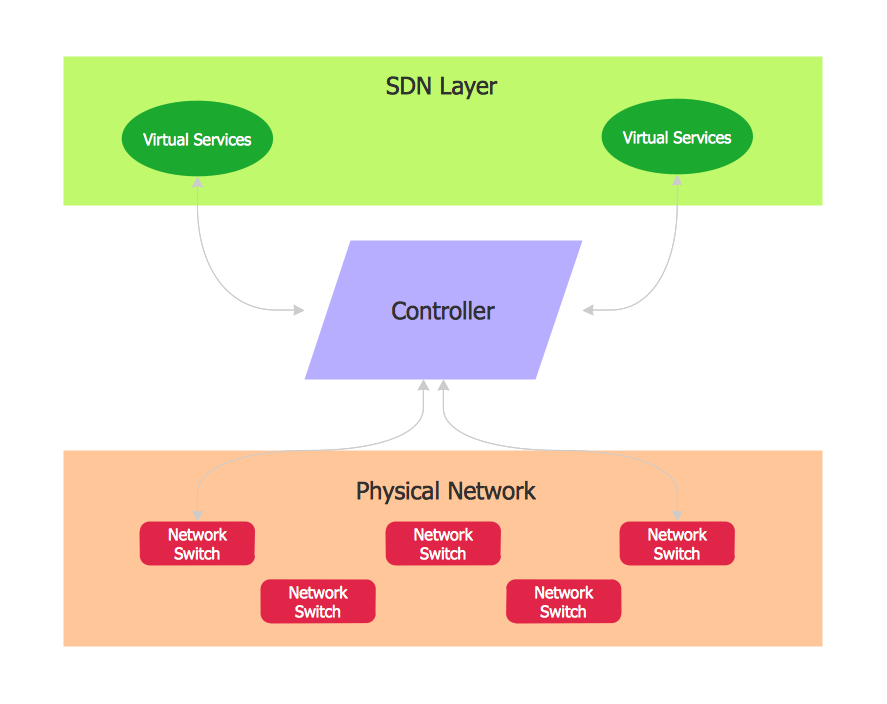
Software Defined Networking System Overview

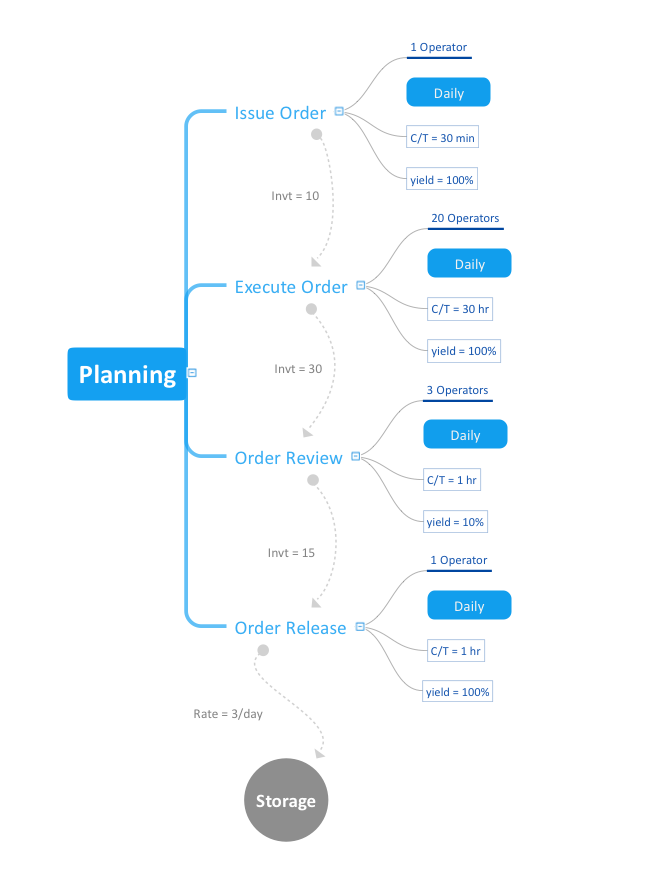
Mind Mapping in the Quality Management
Data Flow Diagram Process

"Data flow diagrams are one of the three essential perspectives of the structured-systems analysis and design method SSADM. The sponsor of a project and the end users will need to be briefed and consulted throughout all stages of a system's evolution. With a data flow diagram, users are able to visualize how the system will operate, what the system will accomplish, and how the system will be implemented. The old system's dataflow diagrams can be drawn up and compared with the new system's data flow diagrams to draw comparisons to implement a more efficient system. Data flow diagrams can be used to provide the end user with a physical idea of where the data they input ultimately has an effect upon the structure of the whole system from order to dispatch to report. How any system is developed can be determined through a data flow diagram model.
In the course of developing a set of levelled data flow diagrams the analyst/ designers is forced to address how the system may be decomposed into component sub-systems, and to identify the transaction data in the data model.
Data flow diagrams can be used in both Analysis and Design phase of the SDLC.
There are different notations to draw data flow diagrams (Yourdon & Coad and Gane & Sarson), defining different visual representations for processes, data stores, data flow, and external entities." [Data flow diagram. Wikipedia]
The DFD (Yourdon and Coad notation) example "Process of account receivable" was created using the ConceptDraw PRO diagramming and vector drawing software extended with the Data Flow Diagrams solution from the Software Development area of ConceptDraw Solution Park.
Data Flow Diagram

The vector stencils library "Scrum arrows" contains 15 shapes.
Use it to design your agile software development diagrams and scrum infographics with ConceptDraw PRO software.
"Agile software development is a set of principles for software development in which requirements and solutions evolve through collaboration between self-organizing, cross-functional teams. It promotes adaptive planning, evolutionary development, early delivery, and continuous improvement, and it encourages rapid and flexible response to change. Agile itself has never defined any specific methods to achieve this, but many have grown up as a result and have been recognized as being 'Agile'." [Agile software development. Wikipedia]
The diagram shapes sample "Design elements - Scrum arrows" is included in the Scrum solution from the Project Management area of ConceptDraw Solution Park.
Arrow shapes
Chart Examples

- Evolution of the population - Line chart | Example Of Divergence ...
- Evolution of the population | Divergence Line Graph
- Line chart - Evolution of the population | Line Chart Examples | Chart ...
- Flowchart On Evolution Of Accounting
- Us Population Evolution Graph
- Line Graph | Process Flowchart | What Is a Line Chart | Evolution ...
- Chemical Evolution Flow Chart
- The Evolution Of Marketing In A Flow Diagram
- Evolution Of Marketing Flow Chart
- Evolution Of Transport System Flowchart
- Sketch The Evolution Of Information System
- Flow Chart Of Evolution Of Marketing
- Biology Drawing | How Does Taxonomy Support The Evolution
- Evolution Funny Pictogram
- Seven Qc Tools Evolution
- Long Term Evolution Access Network
- Image Flow Chart On Evolution
- Evolution Of Information System In Flow Chart In Hd Clear
- Venn Diagrams | Evolution Of Urban Planning