HelpDesk
How to Create a Fishbone (Ishikawa) Diagram Quickly
 Diagram Quickly")
HelpDesk
How to Draw a Fishbone Diagram

HelpDesk
How To Create Cause and Effect (Fishbone) Diagram in MS Visio
 Diagram in MS Visio")
 Fishbone Diagrams
The Fishbone Diagrams solution extends ConceptDraw DIAGRAM software with the ability to easily draw the Fishbone Diagrams (Ishikawa Diagrams) to clearly see the cause and effect analysis and also problem solving. The vector graphic diagrams produced using this solution can be used in whitepapers, presentations, datasheets, posters, and published technical material.
HelpDesk
How to Add a Fishbone (Ishikawa) Diagram to an MS Word Document

Total Quality Management with ConceptDraw

Fishbone Diagram Procedure

Fishbone Diagram Template

Seven Basic Tools of Quality — Quality Control

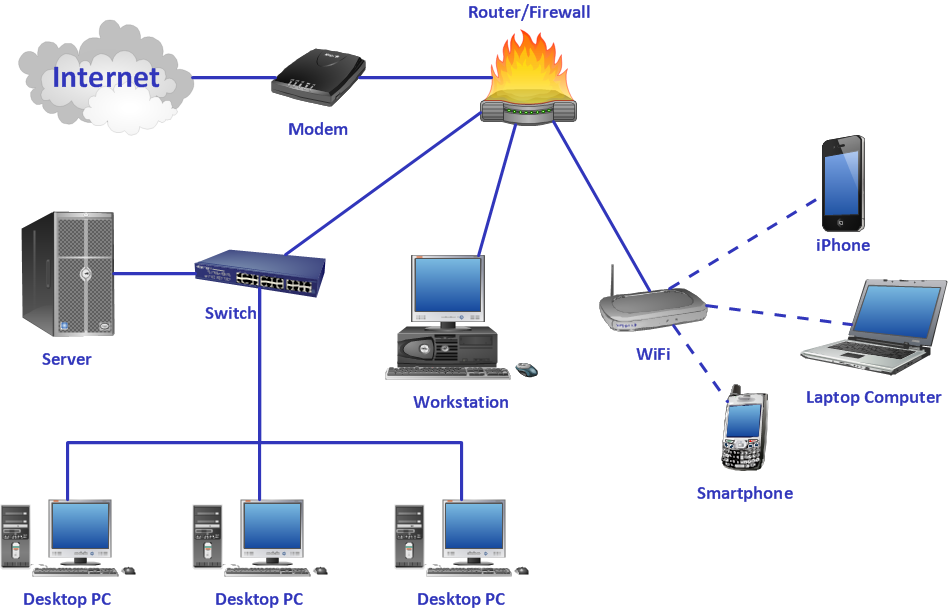
Diagrama de Topologia
Flowchart Software


Example of Flowchart Diagram

 Seven Basic Tools of Quality
Manage quality control in the workplace, using fishbone diagrams, flowcharts, Pareto charts and histograms, provided by the Seven Basic Tools of Quality solution.
Crea Diagramas De Flujo
Planogram Software and Retail Plan Software

- Fishbone Diagram | Value Stream Mapping | Cross - Functional ...
- How to Create a Fishbone ( Ishikawa ) Diagram Quickly | Process ...
- Ishikawa Diagram For Inventory
- Event-driven Process Chain Diagrams | Cross - Functional ...
- Data Flow Diagrams (DFD) | Cross - Functional Flowcharts | Fishbone ...
- Business Diagram Software | Ishikawa Diagram In Six Sigma
- Cross - Functional Flowcharts | Gym Workout Plan | Event-driven ...
- Process Flowchart | How to Create a Fishbone ( Ishikawa ) Diagram ...
- Cross - Functional Flowchart | Fishbone Diagram | Entity-Relationship ...
- What Is The Use Of Process Flow Chat By Ishikawa
- Accounts Payable Flowchart | Cross - Functional Flowcharts ...
- Accounting Flowcharts | Cross - Functional Flowcharts | Aerospace ...
- Fishbone Diagram | HVAC Plans | Cross - Functional Flowchart | Air ...
- Total Quality Management Value | Ishikawa Diagram | Cause and ...
- Fishbone Diagram | Software Development | Cross - Functional ...
- Ishikawa Diagram | Total Quality Management Value | Using ...
- Process Flowchart | Fishbone Diagram | Fishbone Diagrams ...
- Total Quality Management TQM Diagrams | Cross - functional ...
- Business Process Workflow Diagram | How to Create a Fishbone ...
- Manufacturing 8 Ms fishbone diagram - Template | Bar Diagrams for ...