 Fishbone Diagram
Fishbone Diagrams solution extends ConceptDraw DIAGRAM software with templates, samples and library of vector stencils for drawing the Ishikawa diagrams for cause and effect analysis.
 Value Stream Mapping
Value stream mapping solution extends ConceptDraw DIAGRAM software with templates, samples and vector stencils for drawing the Value Stream Maps (VSM) in lean manufacturing practice.
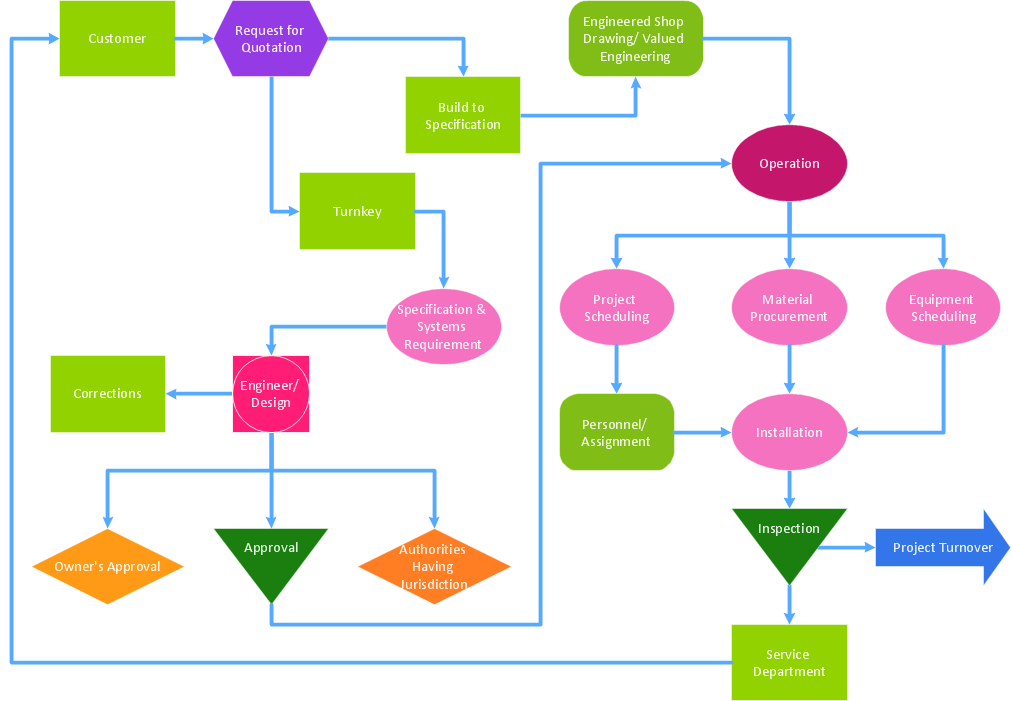
 Cross-Functional Flowcharts
Cross-functional flowcharts are powerful and useful tool for visualizing and analyzing complex business processes which requires involvement of multiple people, teams or even departments. They let clearly represent a sequence of the process steps, the order of operations, relationships between processes and responsible functional units (such as departments or positions).
 Entity-Relationship Diagram (ERD)
Entity-Relationship Diagram (ERD) solution extends ConceptDraw DIAGRAM software with templates, samples and libraries of vector stencils from drawing the ER-diagrams by Chen's and crow’s foot notations.
Best Value — Total Quality Management
Applications

 SWOT Analysis
SWOT and TOWS Matrix Diagrams solution extends ConceptDraw DIAGRAM and ConceptDraw MINDMAP software with features, templates, samples and libraries of vector stencils for drawing SWOT and TOWS analysis matrices and mind maps.
Software development with ConceptDraw DIAGRAM

- Business Productivity Diagramming | Fishbone Diagram ...
- SWOT Sample in Computers | SWOT Analysis Tool for Small ...
- TQM Diagram Tool | Mind Mapping in the Quality Management ...
- SWOT Analysis Tool for Small Business | SWOT Analysis | How to ...
- SWOT Analysis Tool for Small Business | SWOT Analysis | Cross ...
- Value Stream Mapping - Conceptdraw.com
- SWOT analysis Software & Template for Macintosh and Windows ...
- How to Create a PowerPoint Presentation from a SWOT Analysis ...
- SWOT Sample in Computers | SWOT Analysis Tool for Small ...
- Mind Maps for Business - SWOT Analysis | SWOT Analysis | What is ...
- How To Do A Mind Map In PowerPoint | Best Mind Mapping ...
- Fishbone Diagram | Entity-Relationship Diagram (ERD) | Value ...
- How to Draw EPC Diagram Quickly | Modelling Concepts for ...
- IVR Network Diagram | Applications | Comparing ConceptDraw PRO ...
- Fishbone Diagram | Cause and Effect Analysis (Fishbone Diagrams ...