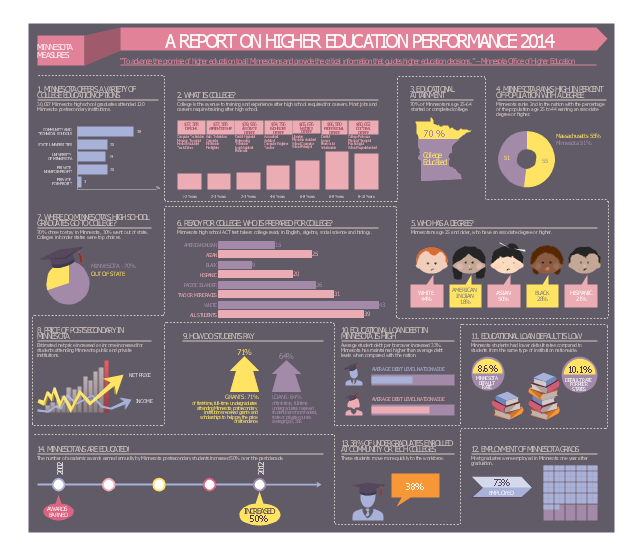
"The Minnesota Office of Higher Education is a cabinet-level state agency providing students with financial aid programs and information to help them gain access to postsecondary education. The agency also serves as the state’s clearinghouse for data, research and analysis on postsecondary enrollment, financial aid finance and trends." [ohe.state.mn.us/ pdf/ MN_ MeasuresInfographic.pdf]
The infographic example "Minnesota measures" was created using the ConceptDraw PRO diagramming and vector drawing software extended with the Education Infographics solition from the area "Business Infographics" in ConceptDraw Solution Park.
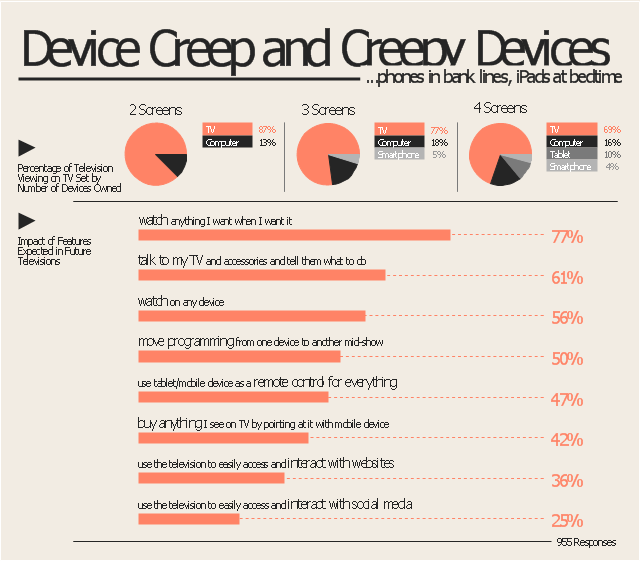
"The Multi-Screen Marketer addresses rapidly shifting consumer media consumption behavior. As devices get smaller and more powerful, our culture is shifting toward instant communication, immediate information gratification and multi-tasking. Consumers are viewing multiple streams of content simultaneously, across a plethora of devices, and brands are learning to chase them across the gaps.
Brand planning and narratives that span tablets, smartphones, laptops, and televisions can create tremendous potential for engagement and sales; failure to adequately anticipate the ways people are interacting with the technology around them can lead to marketing and messaging that is ignored, or worse, out of touch. ...
Device Creep and Creepy Devices.
Adding devices to our lives means some migration from one device to another, but an equally important trend is simply toward more of everything. More media at more times, with digital content displacing some activities and filling the previously unused spaces in consumers’
lives...phones in bank lines, iPads at bedtime, etc." [econsultancy.com/ reports/ the-multi-screen-marketer]
The marketing infographic example "Device creep and creepy devices" was created using the ConceptDraw PRO diagramming and vector drawing software extended with the Marketing Infographics solition from the area "Business Infographics" in ConceptDraw Solution Park.
Excellent Examples of Infographic Maps

How to Make an Infographic

Marketing Plan Infographic

Make an Infographic

Infographic Maker

Typography Infographic Software

How to Draw Pictorial Chart. How to Use Infograms

Sample Pictorial Chart. Sample Infographics
")
Spatial infographics Design Elements: Location Map

Design Pictorial Infographics. Design Infographics

Management Consultant

A management consultant is an important person for the company, he helps in the questions of improving business performance and increasing profits, he consults for the questions of business strategy, management and financial controls, resources, and also suggests recommendations for changing the structure of the company if needed.
So, every day management consultant conduct the complex work and often use the helpful management infographics for explain his thoughts and arguments to the company direction. Thanks to the development of computer technologies, drawing of management infographics is so easy today. ConceptDraw PRO diagramming and vector drawing software offers you the Management Infographics Solution from the Business Infographics Area.
- Education infogram - Template | Minnesota measures - Infogram ...
- Fishbone Diagram Template | Management infogram - Template ...
- Minnesota measures - Infogram | How to Draw Pictorial Chart. How ...
- International education | Minnesota measures - Infogram | Basic ...
- Content Marketing Infographics | Marketing Plan Infographic ...
- Food infogram - Reducing sodium | How To Create Restaurant Floor ...
- Using Infographic For Marketing
- Geo Map - USA - Minnesota | Minnesota measures - Infogram ...
- Marketing Plan Infographic | How to Create Marketing Infographics ...
- Percentage Pie Chart. Pie Chart Examples | EU greenhouse gas ...
- Meter Dashboard | Device creep and creepy devices - Marketing ...
- Food Recipes | Food infogram - Reducing sodium | Fast food ...
- Education infogram - Template | Education infogram 5 - Template ...
- Typography Infographic Examples
- Food infogram - Reducing sodium | Banquet Hall Plan Software ...
- Cross-Functional Flowchart | Food infogram - Reducing sodium ...
- How to Create a Typography Infographic Using ConceptDraw PRO ...
- Food infogram - Reducing sodium | Design elements - Beverages ...
- Winter Sports. Illustrations and Visualize Statistics | Information ...
- Social Media Marketing Infographic | Use of social media marketing ...