This human nutrition infographic example is redesigned from the Reducing Sodium: From Menu to Mouth Infographic on the Centers for Disease Control and Prevention (CDC) website.
"Infographics (Information Graphics) are visual representations of data, information or knowledge that tell a story through visual communication. ... infographics related to sodium and sodium reduction."
[cdc.gov/ salt/ sodium_ infographics.htm]
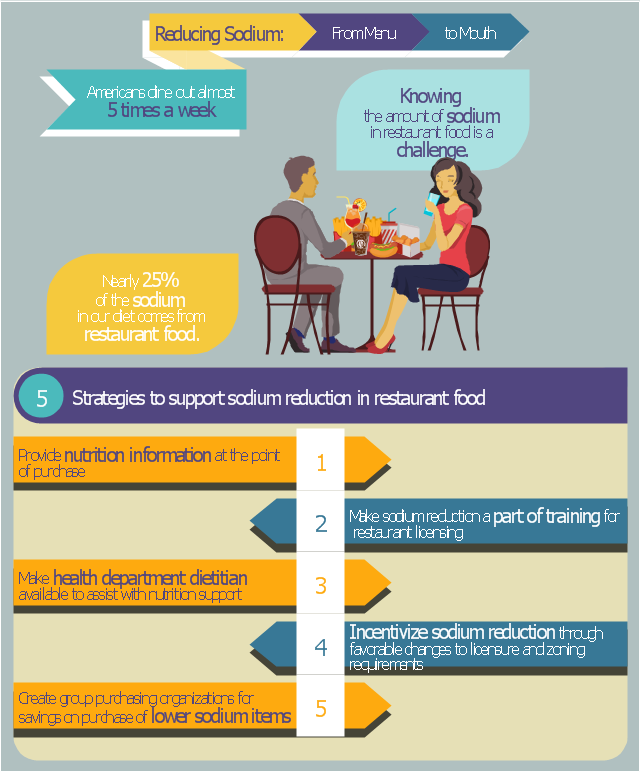
"The average American eats out at a fast food or dine-in restaurant almost five times a week. CDC is collaborating with the food industry to reduce sodium in the food supply and providing technical assistance to the public health community for work on sodium reduction, as it is a public health priority. CDC is offering strategies for how health departments and restaurants can work together for sodium reduction and to provide consumers with healthier choices in the report “From Menu to Mouth: Opportunities for Sodium Reduction in Restaurants,” published ... in CDC’s journal, Preventing Chronic Disease." [cdc.gov/ media/ dpk/ 2014/ dpk-sodium-content.html]
The diet infographics example "Food infogram - Reducing sodium" was drawn using the ConceptDraw PRO diagramming and vector drawing software extended with the Food Court solution from the Food and Beverages area of ConceptDraw Solution Park.
"Infographics (Information Graphics) are visual representations of data, information or knowledge that tell a story through visual communication. ... infographics related to sodium and sodium reduction."
[cdc.gov/ salt/ sodium_ infographics.htm]
"The average American eats out at a fast food or dine-in restaurant almost five times a week. CDC is collaborating with the food industry to reduce sodium in the food supply and providing technical assistance to the public health community for work on sodium reduction, as it is a public health priority. CDC is offering strategies for how health departments and restaurants can work together for sodium reduction and to provide consumers with healthier choices in the report “From Menu to Mouth: Opportunities for Sodium Reduction in Restaurants,” published ... in CDC’s journal, Preventing Chronic Disease." [cdc.gov/ media/ dpk/ 2014/ dpk-sodium-content.html]
The diet infographics example "Food infogram - Reducing sodium" was drawn using the ConceptDraw PRO diagramming and vector drawing software extended with the Food Court solution from the Food and Beverages area of ConceptDraw Solution Park.
Human nutrition infographics
 Plumbing and Piping Plans
Plumbing and Piping Plans solution extends ConceptDraw PRO v10.2.2 software with samples, templates and libraries of pipes, plumbing, and valves design elements for developing of water and plumbing systems, and for drawing Plumbing plan, Piping plan, PVC Pipe plan, PVC Pipe furniture plan, Plumbing layout plan, Plumbing floor plan, Half pipe plans, Pipe bender plans.
 ConceptDraw Solution Park
ConceptDraw Solution Park collects graphic extensions, examples and learning materials
This flow chart sample was drawn on the base on the illustration of the article "Climate change impact on China food security in 2050" from the website of Chinese Academy of Agricultural Sciences .
[caas.cn/ en/ newsroom/ research_ update/ 67347.shtml]
"Food security is a condition related to the ongoing availability of food. ...
According to the Food and Agriculture Organization (FAO), food security "exists when all people, at all times, have physical and economic access to sufficient, safe and nutritious food to meet their dietary needs and food preferences for an active and healthy life". ...
Extreme events, such as droughts and floods, are forecast to increase as climate change takes hold. Ranging from overnight floods to gradually worsening droughts, these will have a range of impacts on the agricultural sector. ...
According to the Climate & Development Knowledge Network report Managing Climate Extremes and Disasters in the Agriculture Sectors: Lessons from the IPCC SREX Report, the impacts will include changing productivity and livelihood patterns, economic losses, and impacts on infrastructure, markets and food security. Food security in future will be linked to our ability to adapt agricultural systems to extreme events." [Food security. Wikipedia]
The flowchart example "Food security assessment" was created using the ConceptDraw PRO diagramming and vector drawing software extended with the Flowcharts solution from the area "What is a Diagram" of ConceptDraw Solution Park.
Flowchart

- Draw Sample Menu For Quick Service Restaurant
- Cocktails And Food Menu Example
- Fast food bar | Fast food menu | How To Create Restaurant Floor ...
- Design elements - Fast food | Fast food bar | Fastfood cafe | Fast Food
- Bio Flowchart | How to Design a Fast- Food Restaurant Menu Using ...
- Www Draw A Plate Of Food
- Basic Flowchart Images. Flowchart Examples | How to Design a Fast ...
- How to Design a Fast- Food Restaurant Menu Using ConceptDraw ...
- How to Design a Fast- Food Restaurant Menu Using ConceptDraw ...
- How To Draw A Plate Of Food
- Copying Service Process Flowchart. Flowchart Examples | Best ...
- Food Court | Health Food | How to Design a Food -related ...
- How To Draw Up A Menu
- Flow Chart For Menu
- Fruit Art | Pictures of Vegetables | Food Art | Examples Of Fruit
- Fast Food Chain Design Plan
- Fast food bar | Food Court | How To Create Restaurant Floor Plan in ...
- Fruit Art | Pictures of Vegetables | Food Court | What Are The ...
- Food Court
- Example Of Fastfood Flow Chart