 Meter Dashboard
Meter dashboard solution extends ConceptDraw PRO software with templates, samples and vector stencils library with meter indicators for drawing visual dashboards showing quantitative data.
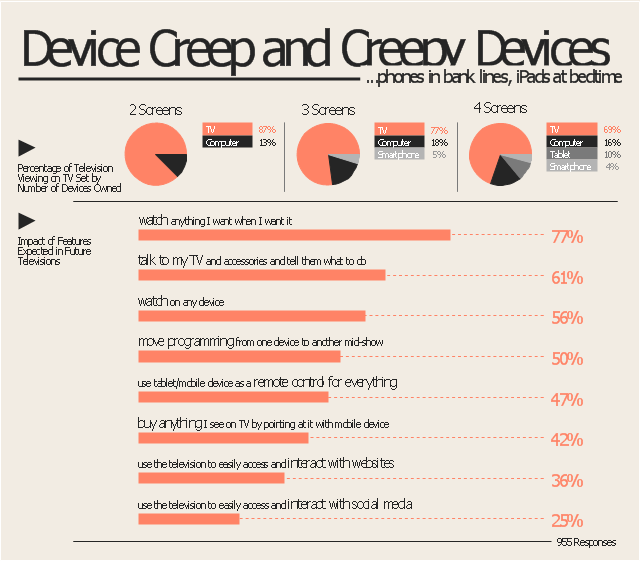
The marketing infogram example "Device creep and creepy devices - Marketing infographics" was created on the base of report "The Multi-Screen Marketer" from the website of the Econsultancy blog.
"The Multi-Screen Marketer addresses rapidly shifting consumer media consumption behavior. As devices get smaller and more powerful, our culture is shifting toward instant communication, immediate information gratification and multi-tasking. Consumers are viewing multiple streams of content simultaneously, across a plethora of devices, and brands are learning to chase them across the gaps.
Brand planning and narratives that span tablets, smartphones, laptops, and televisions can create tremendous potential for engagement and sales; failure to adequately anticipate the ways people are interacting with the technology around them can lead to marketing and messaging that is ignored, or worse, out of touch. ...
Device Creep and Creepy Devices.
Adding devices to our lives means some migration from one device to another, but an equally important trend is simply toward more of everything. More media at more times, with digital content displacing some activities and filling the previously unused spaces in consumers’
lives...phones in bank lines, iPads at bedtime, etc." [econsultancy.com/ reports/ the-multi-screen-marketer]
The marketing infographic example "Device creep and creepy devices" was created using the ConceptDraw PRO diagramming and vector drawing software extended with the Marketing Infographics solition from the area "Business Infographics" in ConceptDraw Solution Park.
Marketing infogram
- Performance Indicators | Enterprise dashboard | Design elements ...
- Performance Indicators | Design elements - Sales KPIs and metrics ...
- KPIs and Metrics | Visualize Sales Data Using Sample Data | Sales ...
- Sales metrics and KPIs - Visual dashboard | Performance Indicators ...
- Performance Indicators | Design elements - Composition charts and ...
- Performance Indicators | PM Dashboards | Design elements - Sales ...
- Performance Indicators | What is a KPI? | KPI Dashboard | Key ...
- Education infogram - Template | Minnesota measures - Infogram ...
- Design elements - Composition charts and indicators | Pie Charts ...
- Performance Indicators | How to Connect Tabular Data (CSV) to a ...
- Enterprise dashboard | Design elements - Meter indicators ...
- Management indicators - Vector stencils library | Design elements ...
- Line Graphs | Basic Line Graphs | Orders by months - Business ...
- KPIs and Metrics | Business Intelligence Dashboard | Design ...
- Website traffic dashboard | Composition Dashboard | Data ...
- Cafe performance metrics vs. air temperature - Visual dashboard ...
- Performance Indicators | Constant improvement of key performance ...
- Enterprise dashboard | Design elements - Meter indicators ...
- Performance Indicators | Constant improvement of key performance ...
- Design elements - Comparison charts and indicators | Design ...