The vector stencils library "Management indicators" contains 14 visual indicators.
Use it to create your management infogram in the ConceptDraw PRO diagramming and vector drawing software.
The example "Management indicators - Vector stencils library" is included in the solution "Marketing infographics" from the "Business infographics" area of ConceptDraw Solution Park.
Use it to create your management infogram in the ConceptDraw PRO diagramming and vector drawing software.
The example "Management indicators - Vector stencils library" is included in the solution "Marketing infographics" from the "Business infographics" area of ConceptDraw Solution Park.
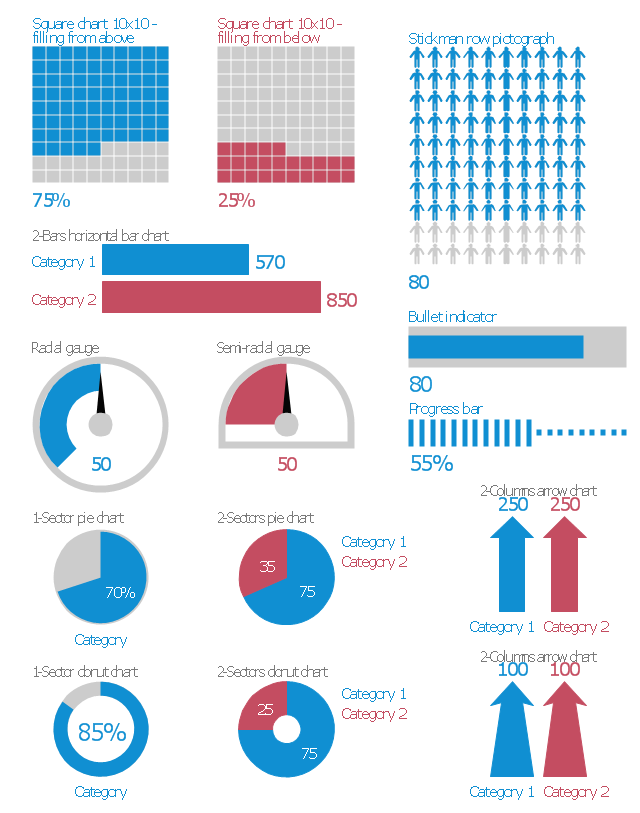
1-Sector donut chart

1-Sector pie chart

2-Bars horizontal bar chart

2-Columns arrow chart
2-Columns arrow chart 2
2-Sectors donut chart

2-Sectors pie chart

Bullet indicator

Progress bar

Radial gauge

Semi-radial gauge

Square chart 10x10 - filling from above

Square chart 10x10 - filling from below

Stickman row pictograph

The vector stencils library "Management indicators" contains 14 graphic indicators: horizontal bar chart, pie chart, arrow chart, donut chart, square chart, stickman row pictograph, progress bar, bullet indicator, radial gauge, semi-radial gauge.
Use these visual indicators to design your management infograms.
The shapes example "Design elements - Management indicators" was created using the ConceptDraw PRO diagramming and vector drawing software extended with the Management Infographics solition from the area "Business Infographics" in ConceptDraw Solution Park.
Graphic indicators
Performance Indicators

Constant improvement of key performance indicators

"Task management is the process of managing tasks through its life cycle. It involves planning, testing, tracking and reporting. Task management can help either individuals achieve goals, or groups of individuals collaborate and share knowledge for the accomplishment of collective goals. Tasks are also differentiated by complexity, from low to high.
Effective task management requires managing all aspects of a task, including its status, priority, time, human and financial resources assignments, recurrency, notifications and so on. These can be lumped together broadly into the basic activities of task management. ...
Task management may form part of project management and process management and can serve as the foundation for efficient workflow in an organisation. Project managers adhering to task-oriented management have a detailed and up-to-date project schedule, and are usually good at directing team members and moving the project forward. ...
Task life cycle.
The status of tasks can be described by the following states:
Ready,
Assigned,
Terminated,
Expired,
Forwarded,
Finished,
Failed." [Task management. Wikipedia]
The example "Project management task status dashboard" was created using the ConceptDraw PRO diagramming and vector drawing software extended with the Status Dashboard solution from the area "What is a Dashboard" of ConceptDraw Solution Park.
Status dashboard

Quality management presentation

Probability Quality Control Tools

Basic Flowchart Symbols and Meaning


The vector stencils library "Meter indicators" contains 29 Live Objects: speedometer gauge, dial, bullet graph, slider and level meter visual indicators.
The Live Objects designed to display actual measures of performance metrics and KPIs from external data source files.
Some of them also display comparative measures, and colored zones of qualitative ranges with legend.
Use it to draw business performance dashboards using the ConceptDraw PRO diagramming and vector drawing software .
"Digital dashboards may be laid out to track the flows inherent in the business processes that they monitor. Graphically, users may see the high-level processes and then drill down into low level data. This level of detail is often buried deep within the corporate enterprise and otherwise unavailable to the senior executives. ...
Specialized dashboards may track all corporate functions. Examples include human resources, recruiting, sales, operations, security, information technology, project management, customer relationship management and many more departmental dashboards. ...
Like a car's dashboard (or control panel), a software dashboard provides decision makers with the input necessary to "drive" the business. Thus, a graphical user interface may be designed to display summaries, graphics (e.g., bar charts, pie charts, bullet graphs, "sparklines," etc.), and gauges (with colors similar to traffic lights) in a portal-like framework to highlight important information. ...
Digital dashboards allow managers to monitor the contribution of the various departments in their organization. To gauge exactly how well an organization is performing overall, digital dashboards allow you to capture and report specific data points from each department within the organization, thus providing a "snapshot" of performance." [Dashboard (management information systems). Wikipedia]
The example "Design elements - Meter indicators" is included in the Meter Dashboard solution from the area "What is a Dashboard" of ConceptDraw Solution Park.
Visual indicators

"Task management is the process of managing tasks through its life cycle. It involves planning, testing, tracking and reporting. Task management can help either individuals achieve goals, or groups of individuals collaborate and share knowledge for the accomplishment of collective goals. Tasks are also differentiated by complexity, from low to high.
Effective task management requires managing all aspects of a task, including its status, priority, time, human and financial resources assignments, recurrency, notifications and so on. These can be lumped together broadly into the basic activities of task management. ...
Task management may form part of project management and process management and can serve as the foundation for efficient workflow in an organisation. Project managers adhering to task-oriented management have a detailed and up-to-date project schedule, and are usually good at directing team members and moving the project forward. ...
Task life cycle.
The status of tasks can be described by the following states:
Ready,
Assigned,
Terminated,
Expired,
Forwarded,
Finished,
Failed." [Task management. Wikipedia]
The example "Project management task status dashboard" was created using the ConceptDraw PRO diagramming and vector drawing software extended with the Status Dashboard solution from the area "What is a Dashboard" of ConceptDraw Solution Park.
Effective task management requires managing all aspects of a task, including its status, priority, time, human and financial resources assignments, recurrency, notifications and so on. These can be lumped together broadly into the basic activities of task management. ...
Task management may form part of project management and process management and can serve as the foundation for efficient workflow in an organisation. Project managers adhering to task-oriented management have a detailed and up-to-date project schedule, and are usually good at directing team members and moving the project forward. ...
Task life cycle.
The status of tasks can be described by the following states:
Ready,
Assigned,
Terminated,
Expired,
Forwarded,
Finished,
Failed." [Task management. Wikipedia]
The example "Project management task status dashboard" was created using the ConceptDraw PRO diagramming and vector drawing software extended with the Status Dashboard solution from the area "What is a Dashboard" of ConceptDraw Solution Park.
Status dashboard
This financila dashboard example was drawn on the base of the Enterprise dashboard from the Mecklenburg County Government website.
[charmeck.org/ mecklenburg/ county/ CountyManagersOffice/ OMB/ dashboards/ Pages/ Enterprise.aspx]
"In management information systems, a dashboard is "an easy to read, often single page, real-time user interface, showing a graphical presentation of the current status (snapshot) and historical trends of an organization’s key performance indicators to enable instantaneous and informed decisions to be made at a glance."
For example, a manufacturing dashboard may show key performance indicators related to productivity such as number of parts manufactured, or number of failed quality inspections per hour. Similarly, a human resources dashboard may show KPIs related to staff recruitment, retention and composition, for example number of open positions, or average days or cost per recruitment.
Types of dashboards.
Dashboard of Sustainability screen shot illustrating example dashboard layout.
Digital dashboards may be laid out to track the flows inherent in the business processes that they monitor. Graphically, users may see the high-level processes and then drill down into low level data. This level of detail is often buried deep within the corporate enterprise and otherwise unavailable to the senior executives.
Three main types of digital dashboard dominate the market today: stand alone software applications, web-browser based applications, and desktop applications also known as desktop widgets. The last are driven by a widget engine.
Specialized dashboards may track all corporate functions. Examples include human resources, recruiting, sales, operations, security, information technology, project management, customer relationship management and many more departmental dashboards.
Digital dashboard projects involve business units as the driver and the information technology department as the enabler. The success of digital dashboard projects often depends on the metrics that were chosen for monitoring. Key performance indicators, balanced scorecards, and sales performance figures are some of the content appropriate on business dashboards." [Dashboard (management information systems). Wikipedia]
The example "Enterprise dashboard" was created using the ConceptDraw PRO diagramming and vector drawing software extended with the Composition Dashboard solution from the area "What is a Dashboard" of ConceptDraw Solution Park.
Financial dashboard

 Status Dashboard
Status dashboard solution extends ConceptDraw PRO software with templates, samples and vector stencils libraries with graphic indicators for drawing the visual dashboards showing status data.
What is a Quality Management

"As a discipline, task management embraces several key activities. Various conceptual breakdowns exist, and these, at a high-level, always include creative, functional, project, performance and service activities.
Creative activities pertain to task creation. In context, these should allow for task planning, brainstorming, creation, elaboration, clarification, organization, reduction, targeting and preliminary prioritization.
Functional activities pertain to personnel, sales, quality or other management areas, for the ultimate purpose of ensuring production of final goods and services for delivery to customers. In context these should allow for planning, reporting, tracking, prioritizing, configuring, delegating, and managing of tasks.
Project activities pertain to planning and time and costs reporting. These can encompass multiple functional activities but are always greater and more purposeful than the sum of its parts. In context project activities should allow for project task breakdown, task allocation, inventory across projects, and concurrent access to task databases.
Service activities pertain to client and internal company services provision, including customer relationship management and knowledge management. In context these should allow for file attachment and links to tasks, document management, access rights management, inventory of client & employee records, orders & calls management, and annotating tasks.
Performance activities pertain to tracking performance and fulfillment of assigned tasks. In context these should allow for tracking by time, cost control, stakeholders and priority; charts, exportable reports, status updates, deadline adjustments, and activity logging.
Report activities pertain to the presentation of information regarding the other five activities listed, including graphical display." [Task management. Wikipedia]
The example "Project tasks dashboard" was created using the ConceptDraw PRO diagramming and vector drawing software extended with the Status Dashboard solution from the area "What is a Dashboard" of ConceptDraw Solution Park.
Project tasks dashboard

- Quality Status Indicator Graphics
- Management indicators - Vector stencils library | Sales performance ...
- Constant improvement of key performance indicators | TQM Diagram ...
- Management indicators - Vector stencils library | Education ...
- Management indicators - Vector stencils library
- Management indicators - Vector stencils library | Business ...
- Management indicators - Vector stencils library | Management ...
- Project Management Dashboards Examples
- Constant improvement of key performance indicators | TQM Diagram ...
- Dashboard Project Management Kpi
- Picture graphs - Vector stencils library | Management indicators ...
- PM Dashboards | Project management task status dashboard | How ...
- Free Project Dashboard Indicators
- Project task status dashboard - Template
- Project Dashboard Indicators
- Enterprise dashboard | Meter Dashboard | Website KPIs - Visual ...
- Design elements - Management indicators
- Design elements - Management list blocks | Design elements - List ...
- Performance Indicators | Enterprise dashboard | KPI Dashboard ...
- Performance Indicators | Constant improvement of key performance ...