HelpDesk
How to Create Marketing Infographics

Marketing Infographics

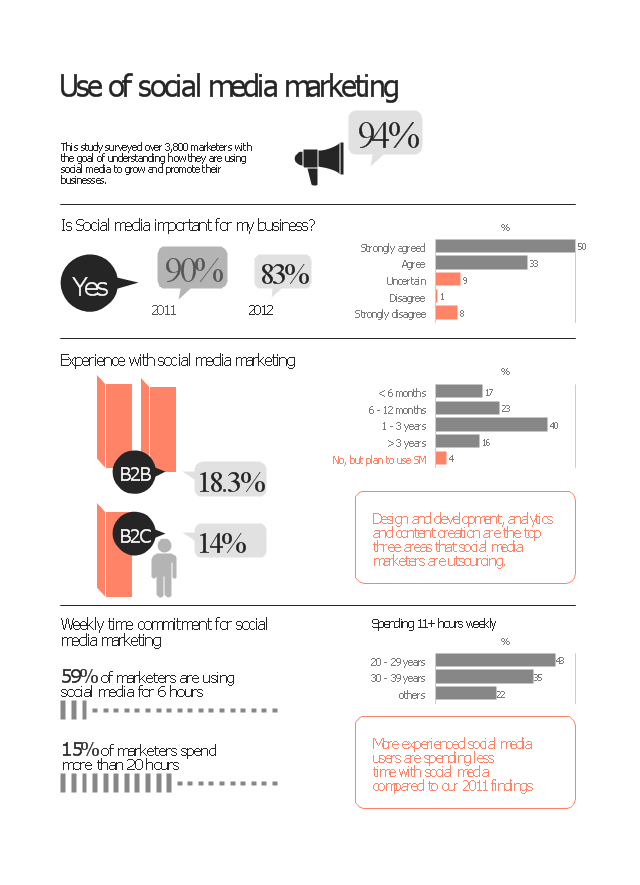
The infogram example "Use of social media marketing" was created on the base of data of "2012 Social Media
Marketing Industry Report. How Marketers Are Using Social Media to Grow Their Businesses" by Michael A. Stelzner from the website of Social Media Examiner.
"This study surveyed over 3,800 marketers with the goal of understanding how they are using social media to grow and promote their business."
[socialmediaexaminer.com/ SocialMediaMarketingIndustryReport2012.pdf]
The infographic example "Use of social media marketing" was created using the ConceptDraw PRO diagramming and vector drawing software extended with the Marketing Infographics solition from the area "Business Infographics" in ConceptDraw Solution Park.
Marketing infogram
Social Media Marketing Infographic

Content Marketing Infographics

Marketing Infographics 2014

HelpDesk
How to Create Management Infographics Using ConceptDraw PRO

HelpDesk
How to Make a Web Page from Infographics in ConceptDraw PRO

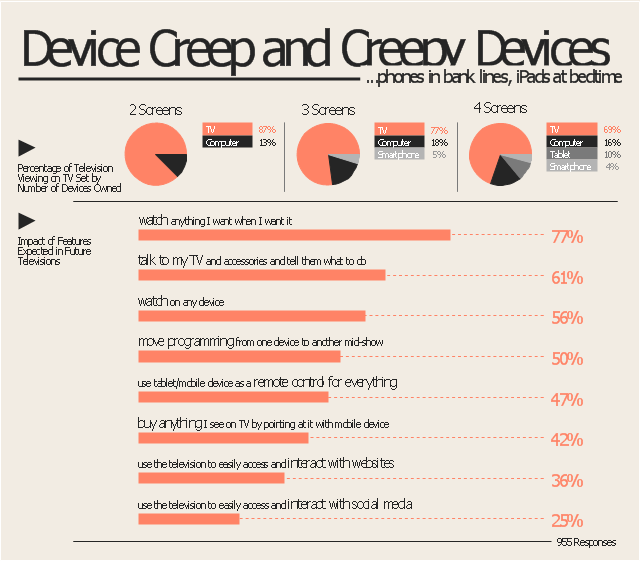
The marketing infogram example "Device creep and creepy devices - Marketing infographics" was created on the base of report "The Multi-Screen Marketer" from the website of the Econsultancy blog.
"The Multi-Screen Marketer addresses rapidly shifting consumer media consumption behavior. As devices get smaller and more powerful, our culture is shifting toward instant communication, immediate information gratification and multi-tasking. Consumers are viewing multiple streams of content simultaneously, across a plethora of devices, and brands are learning to chase them across the gaps.
Brand planning and narratives that span tablets, smartphones, laptops, and televisions can create tremendous potential for engagement and sales; failure to adequately anticipate the ways people are interacting with the technology around them can lead to marketing and messaging that is ignored, or worse, out of touch. ...
Device Creep and Creepy Devices.
Adding devices to our lives means some migration from one device to another, but an equally important trend is simply toward more of everything. More media at more times, with digital content displacing some activities and filling the previously unused spaces in consumers’
lives...phones in bank lines, iPads at bedtime, etc." [econsultancy.com/ reports/ the-multi-screen-marketer]
The marketing infographic example "Device creep and creepy devices" was created using the ConceptDraw PRO diagramming and vector drawing software extended with the Marketing Infographics solition from the area "Business Infographics" in ConceptDraw Solution Park.
Marketing infogram
HelpDesk
How to Create Education Infographics

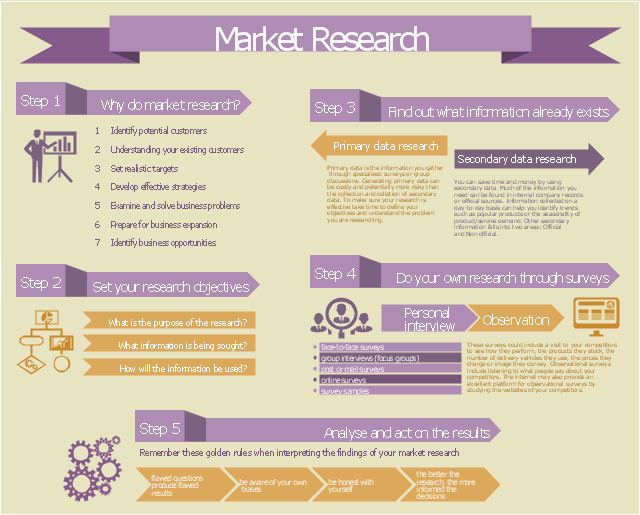
This example of marketing infogram was created on the base of web page "Market research" from the website of West Australian State Government agency Small Business Development Corporation (SBDC).
"Market research is a key part of developing your marketing strategy. It’s about collecting information to give you an insight into your customers’ mind so that you understand what they want, how they gather information and where they come from. You can also do market research to get a better idea of market trends and what is happening in your industry sector.
The information you gather and analyse builds the foundation of good business decisions whether it’s deciding what product or service you’ll offer, where your business should be located, how to distribute your products or how you communicate with consumers." [smallbusiness.wa.gov.au/ market-research]
The example "Marketing Infographics - Market Research" was created using the ConceptDraw PRO diagramming and vector drawing software extended with the Marketing Infographics solition from the area "Business Infographics" in ConceptDraw Solution Park.
Marketing infogram
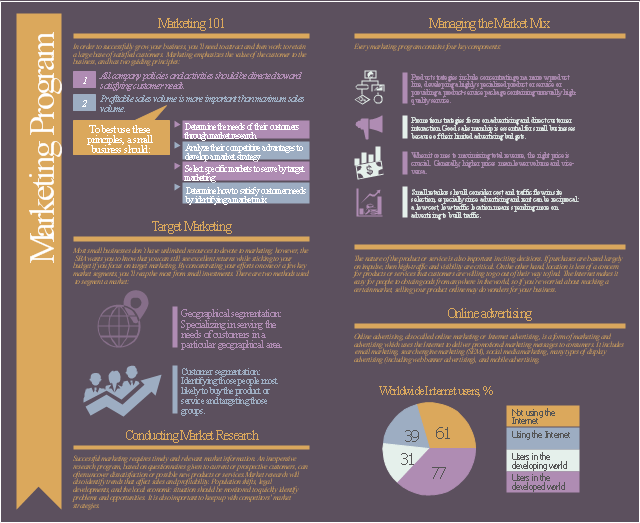
The infogram example "Marketing program" was created on the base of webpages:
(1) Marketing 101. Website of the U.S. Small Business Administration. [sba.gov/ content/ marketing-101-basics]
(2) List of countries by number of Internet users. Wikipedia.
(3) Online advertising. Wikipedia.
"A marketing program is a coordinated, thoughtfully designed set of activities that help you achieve your marketing objectives. Your marketing objectives are strategic sales goals that fit your strengths and are a good way to stretch your business in its current situation. In order to build strong customer relationships and maximize your sales, you need to put every possible marketing tool to work for you. Marketing is a broad field, encompassing elements as diverse as advertising, brand and logo design, sales calls, Web sites, brochures, packaging, shows, conferences and other events, and so on." [dummies.com/ how-to/ content/ designing-your-marketing-program.html]
The infographic example "Marketing program" was created using the ConceptDraw PRO diagramming and vector drawing software extended with the Marketing Infographics solition from the area "Business Infographics" in ConceptDraw Solution Park.
Marketing infogram
HelpDesk
How to Create Data-driven Infographics

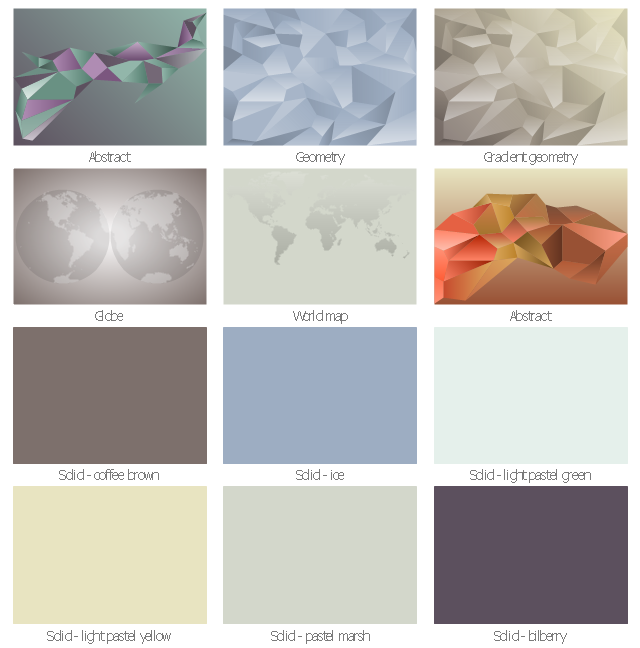
The vector stencils library "Marketing backgrounds" contains 12 infographic backgrounds or wallpapers for creating marketing infograms.
"A wallpaper or background (also known as a desktop wallpaper, desktop background, desktop picture or desktop image on computers) is a digital image (photo, drawing etc.) used as a decorative background of a graphical user interface on the screen of a computer, mobile communications device or other electronic device." [Wallpaper (computing). Wikipedia]
The wallpaper example "Design elements - Marketing backgrounds" was created using the ConceptDraw PRO diagramming and vector drawing software extended with the Marketing Infographics solition from the area "Business Infographics" in ConceptDraw Solution Park.
Infographic backgrounds
HelpDesk
How to Create PowerPoint Presentation from Data Driven Infographics Using ConceptDraw PRO

- Social Media Marketing Infographic | Internet Marketing Infographic ...
- How to Create Marketing Infographics | Content Marketing ...
- Marketing Media Social Social Marketing
- Social Media Marketing Infographic | Use of social media marketing ...
- Marketing Plan Infographic | ConceptDraw Solution Park | Content ...
- How To Create a MS Visio Data-driven Infographics Using ...
- Marketing Plan Infographic | HVAC Marketing Plan | Marketing plan ...
- How to Create Management Infographics Using ConceptDraw PRO ...
- How to Create Management Infographics Using ConceptDraw PRO ...
- Internet marketing - Concept map | Venn diagram - Internet ...
- How to Create Marketing Infographics | Marketing | Flowchart ...
- How to Make an Infographic
- Marketing Diagrams | Flowchart Marketing Process. Flowchart ...
- How to Use ConceptDraw Infographic in Presentations, Documents ...
- What are Infographics Area | How to Create an Infographic ...
- Sample Pictorial Chart. Sample Infographics | Design Pictorial ...
- Device creep and creepy devices - Marketing infographics | Design ...
- Marketing Plan Infographic | Pyramid Charts | Marketing Charts ...
- Design Pictorial Infographics . Design Infographics | Sample Pictorial ...