Marketing Infographics

HelpDesk
How to Create Marketing Infographics

Content Marketing Infographics

Marketing Plan Infographic

Social Media Marketing Infographic

Internet Marketing Infographic

Marketing Infographics 2014

HelpDesk
How to Make a Web Page from Infographics in ConceptDraw PRO

HelpDesk
How to Create Management Infographics Using ConceptDraw PRO

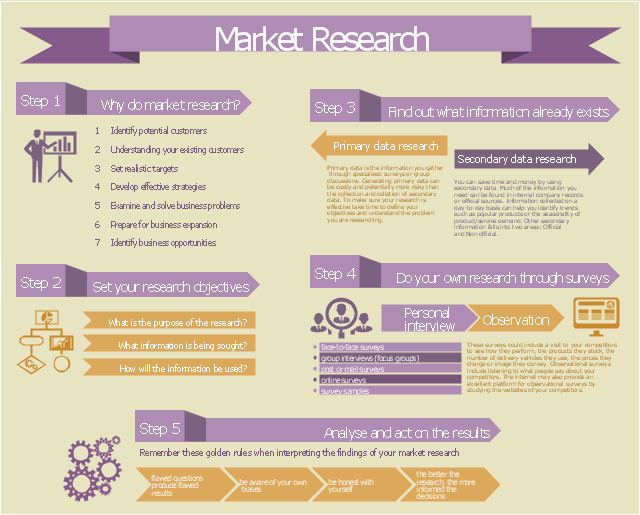
This example of marketing infogram was created on the base of web page "Market research" from the website of West Australian State Government agency Small Business Development Corporation (SBDC).
"Market research is a key part of developing your marketing strategy. It’s about collecting information to give you an insight into your customers’ mind so that you understand what they want, how they gather information and where they come from. You can also do market research to get a better idea of market trends and what is happening in your industry sector.
The information you gather and analyse builds the foundation of good business decisions whether it’s deciding what product or service you’ll offer, where your business should be located, how to distribute your products or how you communicate with consumers." [smallbusiness.wa.gov.au/ market-research]
The example "Marketing Infographics - Market Research" was created using the ConceptDraw PRO diagramming and vector drawing software extended with the Marketing Infographics solition from the area "Business Infographics" in ConceptDraw Solution Park.
Marketing infogram
HelpDesk
How to Create Data-driven Infographics

Infographic software: the sample of New York City Subway map

 ConceptDraw Solution Park
ConceptDraw Solution Park collects graphic extensions, examples and learning materials
- How to Create Marketing Infographics | Marketing Infographics | Use ...
- Marketing Plan Infographic | How to Create Marketing Infographics ...
- Social Media Marketing Infographic | Use of social media marketing ...
- Marketing Plan Infographic | Social Media Marketing Infographic ...
- Internet Marketing Infographic | How to Perform a Dynamic ...
- Internet Marketing Infographic | Marketing Infographics | Content ...
- Content Marketing Infographics | Marketing Plan Infographic | How ...
- How to Create Marketing Infographics | Marketing Plan Infographic ...
- Content Marketing Infographics | Marketing Infographics | Marketing ...
- How to Create Management Infographics Using ConceptDraw PRO ...
- Marketing Plan Infographic | Content Marketing Infographics ...
- Marketing Plan Infographic | ConceptDraw Solution Park | Marketing ...
- Marketing Plan Infographic | Marketing Analysis Diagram | Flowchart ...
- How To Create a MS Visio Data-driven Infographics Using ...
- How To Create a MS Visio Data-driven Infographics Using ...
- Flowchart Marketing Process. Flowchart Examples | Marketing ...
- Marketing Plan Infographic | HVAC Marketing Plan | Marketing plan ...
- Social Media Marketing Infographic | How to Create a Social Media ...
- Internet Marketing Infographic | Internet solutions with ConceptDraw ...