Improving Problem Solving and Focus with Fishbone Diagrams

Fishbone Diagram Example

When To Use a Fishbone Diagram

Winter Sports. Olympic Games Illustrations. Medal Summary

Fishbone Diagram

How Do Fishbone Diagrams Solve Manufacturing Problems

This example was created on the base of the figure from the website of Minnesota Department of Health. [health.state.mn.us/ divs/ opi/ qi/ images/ fishbone_ ex.png]
"Minnesota’s Health Alert Network (HAN) enables public health staff, tribal governments, health care providers, emergency workers, and others working to protect the public to exchange information during a disease outbreak, environmental threat, natural disaster, or act of terrorism." [health.state.mn.us/ han/ ]
The fishbone diagram example "HAN project" was created using the ConceptDraw PRO diagramming and vector drawing software extended with the Fishbone Diagrams solution from the Management area of ConceptDraw Solution Park.
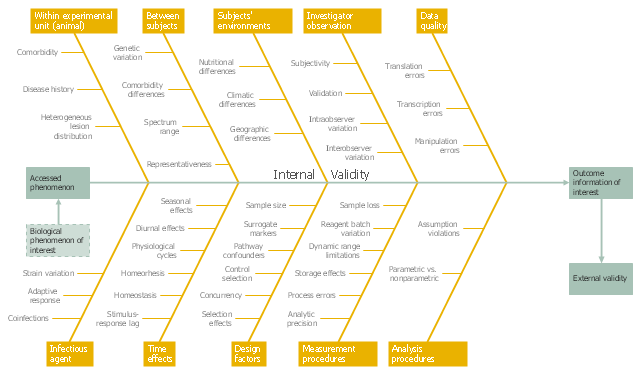
Ishikawa diagram

This example was created on the base of the figure from the website of the WSU College of Veterinary Medicine of the Washington State University. [vetmed.wsu.edu/ courses-jmgay/ images/ Ishikawa%20 Variance%20 Diagram.jpg]
"Internal validity is a property of scientific studies which reflects the extent to which a causal conclusion based on a study is warranted. Such warrant is constituted by the extent to which a study minimizes systematic error (or 'bias')." [Internal validity. Wikipedia]
The fishbone diagram example "Ishikawa variance diagram" was created using the ConceptDraw PRO diagramming and vector drawing software extended with the Fishbone Diagrams solution from the Management area of ConceptDraw Solution Park.
Ishikawa diagram
Fishbone Problem Solving

Cause and Effect Diagram Software

Fishbone Diagram Template

Export from ConceptDraw DIAGRAM Document to a Graphic File


Program Evaluation and Review Technique (PERT) with ConceptDraw DIAGRAM
 with ConceptDraw DIAGRAM *")
Types of Welding in Flowchart

Value Stream Diagram

Relations Diagram

ConceptDraw MINDMAP Export Capabilities

8 Step Problem Solving

Influence Diagram

Interior Design. School Layout — Design Elements

- Fishbone Diagrams | Fishbone diagram - HAN project | DroidDia ...
- Fishbone Diagram | Fishbone Problem Solving | Fishbone Diagrams ...
- Ishikawa variance diagram | Fishbone Diagrams | Personal area ...
- Picture Graphs | Process Flowchart | Fishbone Diagram | Graph ...
- Cause and Effect Analysis - Fishbone Diagrams for Problem Solving ...
- Fishbone diagram - HAN project | Causes And Effects Of Terrorism
- Plumbing and Piping Plans | Picture Graphs | Fishbone Diagram Of ...
- Pie Charts | Fishbone Diagrams | What Is a Picture Graph ...
- Entity-Relationship Diagram (ERD) | Er Diagram Full Hd Image
- How to Connect an Image to a Topic in Your Mind Map | How to ...
- Lean Manufacturing Diagrams | Value-Stream Mapping for ...
- TQM Diagram Tool | Picture Graphs | Seven Basic Tools of Quality ...
- Uml Diagrams For Enhancement In Image Processing Pdf
- Fishbone Diagram | Entity-Relationship Diagram (ERD) | Network ...
- Fishbone Diagrams | Fishbone Diagram | Food Court | Fishbone ...
- Fishbone Diagram | Fishbone Diagrams | How to Draw a Fishbone ...
- Using Fishbone Diagrams for Problem Solving | Venn Diagram ...
- Data Flow Diagram For Image Gallery
- Banking Management System Er Diagram Hd Photos