Copying Service Process Flowchart. Flowchart Examples

Pyramid Chart Examples

Basic Audit Flowchart. Flowchart Examples

Examples of Flowchart


Flowchart Marketing Process. Flowchart Examples

Business Processes

Types of Flowcharts


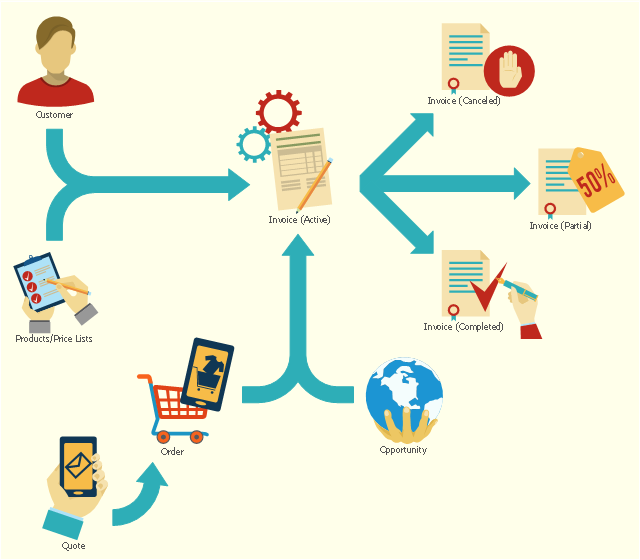
This flowchart example shows the lifecycle of an invoice in Microsoft Dynamics CRM. It was redesigned from the Wikimedia Commons file: Invoice lifecycle.svg. [commons.wikimedia.org/ wiki/ File:Invoice_ lifecycle.svg]
"Microsoft Dynamics CRM is a customer relationship management software package developed by Microsoft. Out of the box, the product focuses mainly on Sales, Marketing, and Service (help desk) sectors...
Dynamics CRM is a server-client application, which, like Microsoft SharePoint, is primarily an IIS-based web application which also supports extensive web services interfaces. Clients access Dynamics CRM either by using a Browser or by a thick client plug-in to Microsoft Outlook." [Microsoft Dynamics CRM. Wikipedia]
The process flowchart example "Invoice lifecycle" was created using the ConceptDraw PRO diagramming and vector drawing software extended with the Sales Flowcharts solution from the Marketing area of ConceptDraw Solution Park.
Lifecycle of an invoice in Microsoft Dynamics CRM
 Event-driven Process Chain Diagrams
Event-driven Process Chain (EPC) Diagram is a type of flowchart widely used for modeling in business engineering and reengineering, business process improvement, and analysis. EPC method was developed within the Architecture of Integrated Information Systems (ARIS) framework.
BPR Diagram. Business Process Reengineering Example

Pyramid Diagram

Flowchart Symbols Accounting. Activity-based costing (ABC) flowchart

Pyramid Diagram

Pyramid Diagram

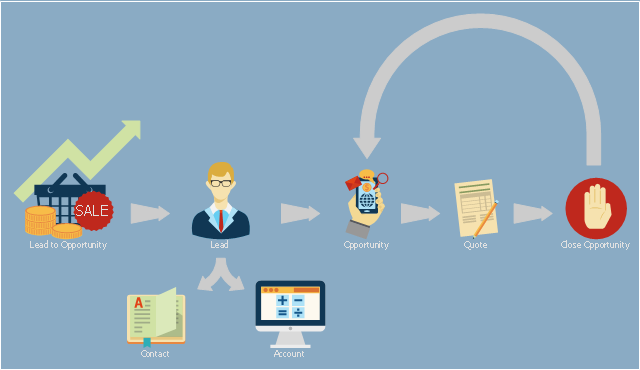
This presales process flowchart example depicts the Microsoft Dynamics CRM workflow from lead to opportunity. It was redesigned from the Wikimedia Commons file: Lead to Opportunity sales flow.svg. [commons.wikimedia.org/ wiki/ File:Lead_ to_ Opportunity_ sales_ flow.svg]
"Presales is a process or a set of activities normally carried out before a customer is acquired, though sometimes presales also extends into the period the product or service is delivered to the customer. ...
In a typical sales cycle the stages are:
(1) Contact.
(2) Lead / Suspect.
(3) Prospect / Opportunity.
The task of a presales person starts from the initial contact phase and often ends once the customer is acquired i.e. sale is made." [Presales. Wikipedia]
The process flowchart example "Lead to opportunity sales flow" was created using the ConceptDraw PRO diagramming and vector drawing software extended with the Sales Flowcharts solution from the Marketing area of ConceptDraw Solution Park.
Presales process flowchart
- Service Marketing Diagram
- Services Marketing In Diagram
- Diagram In Marketing For A Specific Service
- Diagram Of Marketing Of Services
- Pyramid Chart Examples | Copying Service Process Flowchart ...
- Goods And Services For Marketing
- How Can Service Marketing Be Applied With A Diagram
- Marketing - Vector stencils library | Service -goods continuum ...
- Diagram of a Pyramid | Process Flowchart | Service -goods ...
- Real Estate Marketing
- Pyramid Chart Examples | Ecosystem goods and services ...
- Ecosystem goods and services - Segmented pyramid diagram ...
- Flowchart Marketing Process. Flowchart Examples | UK labour ...
- Service -goods continuum diagram | Ecosystem goods and services ...
- Triangle Model Of Service Marketing
- Flowchart Marketing Process. Flowchart Examples | Work Order ...
- Ecosystem goods and services - Segmented pyramid diagram ...
- Example Of Invoice For Services
- After Sales Service Process Flow Chart
- Flow Chart Of A Service Market