Types of Flowchart - Overview


Process Flowchart


"A Guide to the Project Management Body of Knowledge - Fifth Edition provides guidelines for managing individual projects and defines project management related concepts. It also describes the project management life cycle and its related processes, as well as the project life cycle.
The Guide recognizes 47 processes that fall into five basic process groups and ten knowledge areas that are typical of almost all projects.
The five process groups are:
Initiating,
Planning,
Executing,
Monitoring and Controlling,
Closing.
The ten knowledge areas are:
Project Integration Management,
Project Scope Management,
Project Time Management,
Project Cost Management,
Project Quality Management,
Project Human Resource Management,
Project Communications Management,
Project Risk Management,
Project Procurement Management,
Project Stakeholders Management (added in 5th edition).
Each of the ten knowledge areas contains the processes that need to be accomplished within its discipline in order to achieve an effective project management program. Each of these processes also falls into one of the five basic process groups, creating a matrix structure such that every process can be related to one knowledge area and one process group." [A Guide to the Project Management Body of Knowledge. Wikipedia]
The flow chart example "Project management life cycle" was created using the ConceptDraw PRO diagramming and vector drawing software extended with the Flowcharts solution from the area "What is a Diagram" of ConceptDraw Solution Park.
Flowchart - Project management life cycle

Basic Flowchart Symbols and Meaning


Flow chart Example. Warehouse Flowchart


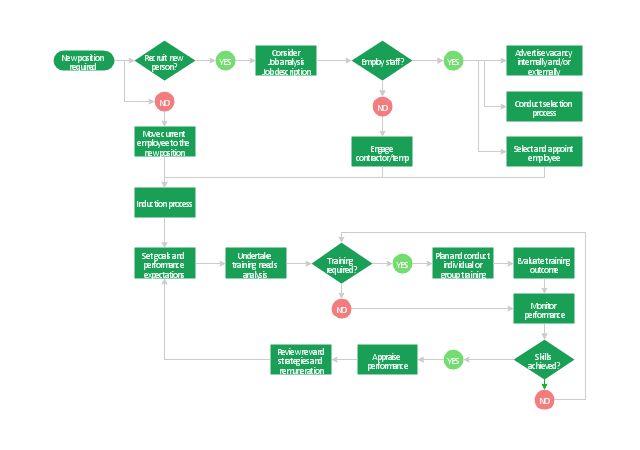
"Human resource management (HRM, or simply HR) is the management process of an organization's workforce, or human resources. It is responsible for the attraction, selection, training, assessment, and rewarding of employees, while also overseeing organizational leadership and culture and ensuring compliance with employment and labor laws. In circumstances where employees desire and are legally authorized to hold a collective bargaining agreement, HR will also serve as the company's primary liaison with the employees' representatives (usually a trades union).
HR is a product of the human relations movement of the early 20th century, when researchers began documenting ways of creating business value through the strategic management of the workforce. The function was initially dominated by transactional work, such as payroll and benefits administration, but due to globalization, company consolidation, technological advancement, and further research, HR now focuses on strategic initiatives like mergers and acquisitions, talent management, succession planning, industrial and labor relations, and diversity and inclusion." [Human resource management. Wikipedia]
The flow chart example "HR management process" was created using the ConceptDraw PRO diagramming and vector drawing software extended with the Flowcharts solution from the area "What is a Diagram" of ConceptDraw Solution Park.
Flowchart - HR management process
"A project management process is the management process of planning and controlling the performance or execution of a project. ...
Inputs:
(1) Documented need to act.
(2) Project plan templates.
(3) Lessons learned from previous projects.
(4) Existing project management standards.
(5) External information.
(6) Resources for project planning and project execution.
Process:
(1) Project initiation.
(2) Project planning.
(3) Project execution.
(4) Project control and validation.
(5) Project closeout.
Outputs:
(1) Project products delivered.
(2) Project objectives achieved (as a result of the interplay among project products and the organization or its environment).
(3) Lessons learned documented." [Project management process. Wikipedia]
The audit flowchart example "Project management process" was created using the ConceptDraw PRO diagramming and vector drawing software extended with the Audit Flowcharts solution from the Finance and Accounting area of ConceptDraw Solution Park.
www.conceptdraw.com/ solution-park/ finance-audit-flowcharts
Audit flowchart

Work Order Process Flowchart. Business Process Mapping Examples

"Project planning is part of project management, which relates to the use of schedules such as Gantt charts to plan and subsequently report progress within the project environment.
Initially, the project scope is defined and the appropriate methods for completing the project are determined. Following this step, the durations for the various tasks necessary to complete the work are listed and grouped into a work breakdown structure. Project planning is often used to organize different areas of a project, including project plans, work loads and the management of teams and individuals. The logical dependencies between tasks are defined using an activity network diagram that enables identification of the critical path. Float or slack time in the schedule can be calculated using project management software. Then the necessary resources can be estimated and costs for each activity can be allocated to each resource, giving the total project cost. At this stage, the project schedule may be optimized to achieve the appropriate balance between resource usage and project duration to comply with the project objectives. Once established and agreed, the project schedule becomes what is known as the baseline schedule. Progress will be measured against the baseline schedule throughout the life of the project. Analyzing progress compared to the baseline schedule is known as earned value management.
The inputs of the project planning phase include the project charter and the concept proposal. The outputs of the project planning phase include the project requirements, the project schedule, and the project management plan." [Project planning. Wikipedia]
The flow chart example "Project planning process" was created using the ConceptDraw PRO diagramming and vector drawing software extended with the Flowcharts solution from the area "What is a Diagram" of ConceptDraw Solution Park.
Flowchart - Project planning process

Contoh Flowchart

Cross-Functional Flowchart


How to Create a Social Media DFD Flowchart

Material Requisition Flowchart. Flowchart Examples

How To Create a Flow Chart in ConceptDraw

TQM Diagram Example

- How to Create a HR Process Flowchart Using ConceptDraw PRO ...
- HR management process - Flowchart | Types of Flowchart ...
- HR management process - Flowchart
- System Organisation Design Using Dfd
- Tqm Flowchart Example
- Management Control And Information Systems Flowchart
- Project management life cycle - Flowchart | Basic Diagramming | PM ...
- Property Management Examples | Land sales process flowchart ...
- Project management life cycle - Flowchart | Project planning process ...
- Process Flowchart | Total Quality Management Value | Types of ...
- Project management process | Flowchart
- Chart Of Management Information System With Diagram
- Flowchart Marketing Process. Flowchart Examples | Sales Process ...
- Basic Flowchart Symbols and Meaning | Audit Flowchart Symbols ...
- Business Process Management Flow Chart
- Process Flowchart | TQM Diagram Example | TQM Diagram ...
- How to Draw an Organization Chart | ConceptDraw PRO ...
- Types of Flowchart - Overview | HR management process ...
- Flowchart Matrix Management
- Audit flowchart - Project management process | Project management ...