Amazon Web Services Diagrams diagramming tool for architecture

Create Flow Chart on Mac

Windows Azure

Amazon Web Services

Diagrama de Topologia

Cross-Functional Flowchart


Flowchart of Products Flowchart Examples

Flow Chart Online

Flow Chart Symbols

Cisco Network Diagram Software

Basic of Flowchart: Meaning and Symbols


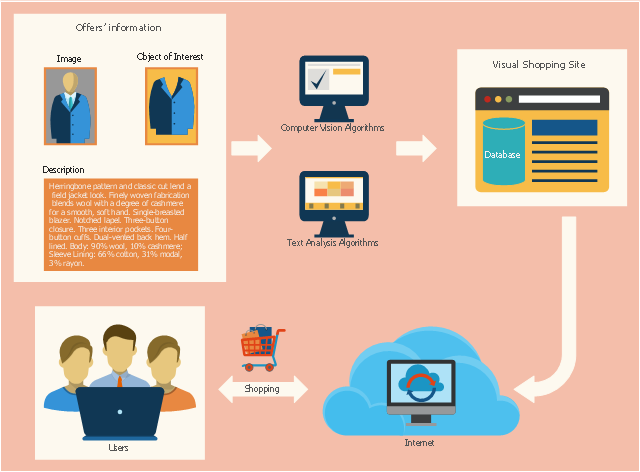
This sales flowchart example was redesigned from the Wikimedia Commons file: Visual shopping scheme.pdf. [commons.wikimedia.org/ wiki/ File:Visual_ shopping_ scheme.pdf]
"Online shopping (sometimes known as e-tail from "electronic retail" or e-shopping) is a form of electronic commerce which allows consumers to directly buy goods or services from a seller over the Internet using a web browser. Alternative names are: e-web-store, e-shop, e-store, Internet shop, web-shop, web-store, online store, online storefront and virtual store. Mobile commerce (or m-commerce) describes purchasing from an online retailer's mobile optimized online site or app." [Online shopping. Wikipedia]
The example "Visual shopping scheme" was created using the ConceptDraw PRO diagramming and vector drawing software extended with the Sales Flowcharts solution from the Marketing area of ConceptDraw Solution Park.
Online shopping flowchart
Flowchart Design Flowchart Symbols, Shapes, Stencils and Icons


ER Diagram Tool

Workflow Diagram Software

Business Diagram Software

ConceptDraw DIAGRAM - Organizational chart software

Contoh Flowchart

Best Vector Drawing Application for Mac OS X

- Basic Flowchart Symbols and Meaning | Workflow Application ...
- Basic Flowchart Symbols and Meaning | Flowchart design ...
- Amazon Web Services Diagrams diagramming tool for architecture ...
- Amazon Web Services Diagrams diagramming tool for architecture ...
- Bio Flowchart | Visio Professional Flowchart Icons For Web ...
- Example of DFD for Online Store (Data Flow Diagram ) DFD ...
- How To create Diagrams for Amazon Web Services architecture ...
- Example of DFD for Online Store (Data Flow Diagram ) | Basic ...
- Cloud Computing Architecture Diagrams | How To create Diagrams ...
- | Workflow Application | | App Diagram