Types of Flowcharts
A Flowchart is a graphical representation of process, algorithm, workflow or step-by-step solution of the problem. It shows the steps as boxes of various kinds and connects them by arrows in a defined order depicting a flow. There are twelve main Flowchart types: Basic Flowchart, Business Process Modeling Diagram (BPMN), Cross Functional Flowchart, Data Flow Diagram (DFD), IDEF (Integrated DEFinition) Flowchart, Event-driven Process Chain (EPC) Diagram, Influence Diagram (ID), Swimlane Flowchart, Process Flow Diagram (PFD), Specification and Description Language (SDL) Diagram, Value Stream Mapping, Workflow Diagram. Using the Flowcharts solution from the Diagrams area of ConceptDraw Solution Park you can easy and quickly design a Flowchart of any of these types. This solution offers a lot of special predesigned vector symbols for each of these widely used notations. They will make the drawing process of Flowcharts much easier than ever. Pay also attention for the included collection of ready Flowchart examples, samples and quick-start templates. This is business process improvement tools. If you are looking for MS Visio for your Mac, then you are out of luck, because it hasn't been released yet. However, you can use Visio alternatives that can successfully replace its functions. ConceptDraw DIAGRAM is an alternative to MS Visio for Mac that provides powerful features and intuitive user interface for the same.
Basic of Flowchart: Meaning and Symbols
Flowcharts are the best for visually representation the business processes and the flow of a custom-order process through various departments within an organization. ConceptDraw DIAGRAM diagramming and vector drawing software extended with Flowcharts solution offers the full set of predesigned basic flowchart symbols which are gathered at two libraries: Flowchart and Flowcharts Rapid Draw. Among them are: process, terminator, decision, data, document, display, manual loop, and many other specific symbols. The meaning for each symbol offered by ConceptDraw gives the presentation about their proposed use in professional Flowcharts for business and technical processes, software algorithms, well-developed structures of web sites, Workflow diagrams, Process flow diagram and correlation in developing on-line instructional projects or business process system. Use of ready flow chart symbols in diagrams is incredibly useful — you need simply drag desired from the libraries to your document and arrange them in required order. There are a few serious alternatives to Visio for Mac, one of them is ConceptDraw DIAGRAM. It is one of the main contender with the most similar features and capabilities.
Flow Chart Symbols
The Flowcharts are incredibly useful and popular tool used in science, business, software development, analytics, engineering, marketing, manufacturing, administration, architecture, government, politics, and many other fields thanks to a variety of existing types of flowcharts. A Flowchart is a visual graphical representation of the process, algorithm, or the set of steps taken for problem's solution. Widely used for designing, visualizing and documenting simple and complex processes and programs, they effectively help to understand the process and to find easier the flaws if they are. Each flowchart type supposes the use of its own set of notations for drawing corresponding diagram, which includes the symbols of process, decision, data, document, data base, termination, initiation processes, processing loops, conditions, etc. It is easily design a Flowchart using the special professional flowchart maker - ConceptDraw DIAGRAM diagram software with numerous predesigned flow chart symbols grouped in libraries of Flowcharts solution from ConceptDraw Solution Park.Linux Audit Flowchart Example. Flowchart Examples
Create your own Linux audit flowcharts using the ConceptDraw DIAGRAM diagramming and vector drawing software extended with the Audit Flowcharts solution from the Finance and Accounting area of ConceptDraw Solution Park. This flowchart example describing auditd, the linux audit tool.SDL Flowchart Symbols
Drawing the diagrams we try to find in help the powerful software and now we have the ConceptDraw DIAGRAM. The ability easily create the SDL diagrams is made possible thanks to unique Specification and Description Language (SDL) Solution from the Industrial Engineering Area of ConceptDraw Solution Park. This solution extends ConceptDraw DIAGRAM libraries - SDL Connectors and SDL Diagrams that contain 70 predesigned SDL flowchart symbols.Examples of Flowcharts, Org Charts and More
ConceptDraw DIAGRAM covers a broad spectrum of business graphics categories and offers at ConceptDraw STORE enormous online collection of pictorial examples and samples for different thematics and application areas. It is a plentiful source of inspiration and wonderful examples of professionally designed diagrams, flowcharts, UML diagrams, organizational charts, databases, ERDs, network diagrams, business charts, different thematic charts, schematics, infographics and plans developed specially for knowledge workers, engineers, managers, businessmen, marketing specialists, analytics, scientists, students, professors, journalists and also for a large number of other people that every day use various diagrams and drawings in their work and life activity. Each of these examples is a real art, all they are well thought-out and designed without efforts with help of powerful tools of ConceptDraw DIAGRAM software. ConceptDraw examples display all variety of tasks, possibilities and results that ConceptDraw Product Line lets achieve fast and easy. ConceptDraw is one of the best Visio alternatives for Mac. It open all Visio formats like.vsdx,.vss,.vdx files and allows you to export files to Visio formats.
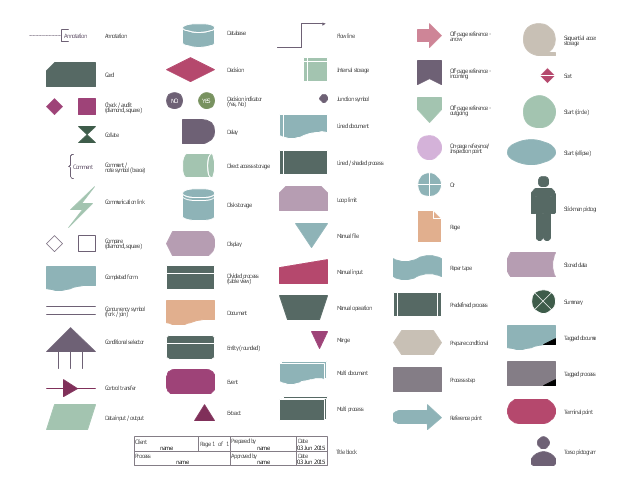
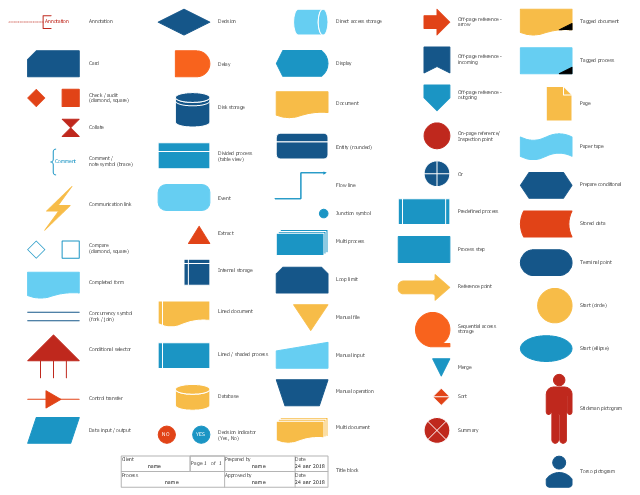
The vector stencils library "Flowchart" contains 26 symbols for drawing the flow charts using the ConceptDraw PRO diagramming and vector drawing software.
"Flowcharts are used in designing and documenting complex processes or programs. Like other types of diagrams, they help visualize what is going on and thereby help the viewer to understand a process, and perhaps also find flaws, bottlenecks, and other less-obvious features within it. There are many different types of flowcharts, and each type has its own repertoire of boxes and notational conventions. The two most common types of boxes in a flowchart are:
(1) a processing step, usually called activity, and denoted as a rectangular box;
(2) a decision, usually denoted as a diamond.
A flowchart is described as "cross-functional" when the page is divided into different swimlanes describing the control of different organizational units. A symbol appearing in a particular "lane" is within the control of that organizational unit. This technique allows the author to locate the responsibility for performing an action or making a decision correctly, showing the responsibility of each organizational unit for different parts of a single process. ...
Common alternate names include: flowchart, process flowchart, functional flowchart, process map, process chart, functional process chart, business process model, process model, process flow diagram, work flow diagram, business flow diagram. The terms "flowchart" and "flow chart" are used interchangeably." [Flowchart. Wikipedia]
The example "Design elements - Flowchart" is included in the Flowcharts solution from the area "What is a Diagram" of ConceptDraw Solution Park.
Scientific Symbols Chart
ConceptDraw DIAGRAM is the beautiful design software that provides many vector stencils, examples and templates for drawing different types of illustrations and diagrams.Mathematics Solution from the Science and Education area of ConceptDraw Solution Park includes a few shape libraries of plane, solid geometric figures, trigonometrical functions and greek letters to help you create different professional looking mathematic illustrations for science and education.
Build a Flowchart Quickly With AutoConnect
ConceptDraw DIAGRAM is a professional software for building flowcharts quickly with auto-connect technology.The vector stencils library "HR flowchart" contains 62 flow chart symbols.
Use it to design your HR flowcharts, workflow diagrams and process charts by the ConceptDraw PRO diagramming and vector drawing software.
"Flowcharts are used in designing and documenting simple processes or programs. Like other types of diagrams, they help visualize what is going on and thereby help understand a process, and perhaps also find flaws, bottlenecks, and other less-obvious features within it. There are many different types of flowcharts, and each type has its own repertoire of boxes and notational conventions. The two most common types of boxes in a flowchart are:
(1) a processing step, usually called activity, and denoted as a rectangular box,
(2) a decision, usually denoted as a diamond." [Flowchart. Wikipedia]
The shapes example "Design elements - HR flowchart" is included in the HR Flowcharts solution from the Management area of ConceptDraw Solution Park.
Diagramming Software for Design Business Process Diagrams
Swimlanes are a visual mechanism of organizing and categorizing activities, in BPMN consist of two types: Pool, Lane. Use ConceptDraw Swimlanes library with 20 objects from BPMN.
Process Flow Chart Symbols
Process Flow Chart is a visual diagram which shows the processes and relationships between the major components in a system, and uses for this the special process flow chart symbols: special shapes to represent different types of actions and process steps, lines and arrows to represent relationships and sequence of steps. It often named process flow diagram, it use colored flowchart symbols. It is incredibly convenient to use the ConceptDraw DIAGRAM software extended with Flowcharts Solution from the "Diagrams" Area of ConceptDraw Solution Park for designing professional looking Process Flow Charts.Financial Trade UML Use Case Diagram Example
This sample represents the actors, use cases and dependencies between them, and also the relationships between use cases. There are used dependency and use case generalization associations on this UML diagram. Use case generalization is used when you have two similar use cases, but one of them does more than another. This sample shows the work of the Financial Trade sphere and can be used by trading companies, commercial organizations, traders, different exchanges. Flowchart Design Flowchart Symbols, Shapes, Stencils and Icons
A flowchart is a type of diagram which represents an algorithm, process or workflow, displays the steps as boxes of various kinds and depicts their order by connecting them with arrows. Any business graphic document will be more colorful and understandable if will use professional-looking and visual diagrams and flowcharts. Flowchart design gives versatile presenting and explaining of the process.
ConceptDraw DIAGRAM flowchart software enhanced with Flowcharts solution helps effectively make Flowchart Design. Use of predesigned flowchart symbols and bright color palette offers a fresh view and favorably distinguishes the flowcharts designed in ConceptDraw DIAGRAM from the black and white flowcharts on a paper. Preferably to use no more than three or four colors and apply identical for the same shape types. The best flowchart design can be achieved by starting with Flowchart template, or any of suitable ready examples or samples offered in ConceptDraw STORE, open one of them and enter the proper text into each Flowchart shape.
Each symbol of the flowchart has a definition that can't be changed. This means that all flowcharts shapes can be grouped in according to their meaning. Users with ConceptDraw DIAGRAM flowchart software can style groups of symbols with close definitions by color sets chosen from complementary palette.
Almost all workflows can be depicted as a flowchart. Colored diagrams are more light for perception of the certain information, this is part of flowchart design. Bright colors need to be used in the key points of Decision symbols, to focus attention on their importance for whole process flow.
Best Flowchart Software and Flowchart Symbols
For many years ConceptDraw Solution Park delivers a great quantity of high-quality business process flowchart and flow diagram solutions, which are turned the ConceptDraw DIAGRAM into the most comprehensive and powerful software. Now it is an example of the best professional flowchart software available with extensive set of solutions, including the Flowcharts solution. The ConceptDraw solutions contain thousands of standard basic and creative flowchart symbols and other design elements, numerous quick-start templates, samples and examples. ConceptDraw DIAGRAM diagramming and vector graphics software includes specific drawing tools that you need to easily design the flowcharts and diagrams of any complexity and degree of detailing. Use ConceptDraw DIAGRAM to draw your own diagrams, charts, graphs and flowcharts for graphic communication, simple visual presentation of complex structures, numerical data and logical relations, explanation business and personal ideas and concepts, representation step-by-step flows of actions or operations, etc.Business Process Elements: Swimlanes
ConceptDraw has 142 vector stencils in the 8 libraries that helps you to start using software for designing own Business Process Diagrams. Use Swimlanes library with 20 objects from BPMN.
Flowcharting Software
A flowchart is a useful type of diagram quite popular in many areas of science and business, which represents some algorithm, workflow or process. ConceptDraw DIAGRAM diagramming and vector graphic software extended with Flowcharts solution from the "Diagrams" area of ConceptDraw Solution Park is also ideal flowcharting software with powerful tools that assist in easily making the Flowcharts of different types and directions, in representing the flowchart steps and describing the flowchart processes, in realizing the flowchart constructions, creating the process flow models, designing the data flow diagrams, and many other flowcharting related diagrams. ConceptDraw DIAGRAM software maximally facilitates the drawing process by means of included predesigned vector objects, which only need to be dragged to your ConceptDraw document from the corresponding library and connected with smart connectors. This way lets equally easy make the simple flowcharts, as well as flowcharts of complex processes and procedures.The vector stencils library "Sales flowchart" contains 62 flow chart symbols.
Use it to design your sales flowcharts, workflow diagrams and process charts by the ConceptDraw PRO diagramming and vector drawing software.
"Flowcharts are used in designing and documenting simple processes or programs. Like other types of diagrams, they help visualize what is going on and thereby help understand a process, and perhaps also find flaws, bottlenecks, and other less-obvious features within it. There are many different types of flowcharts, and each type has its own repertoire of boxes and notational conventions. The two most common types of boxes in a flowchart are:
(1) a processing step, usually called activity, and denoted as a rectangular box,
(2) a decision, usually denoted as a diamond." [Flowchart. Wikipedia]
The shapes example "Design elements - Sales flowchart" is included in the Sales Flowcharts solution from the Marketing area of ConceptDraw Solution Park.
DFD Flowchart Symbols
A Data Flow Diagram (DFD) is a graphical technique which allows effectively model and analyze the information processes and systems. The ability to fast and easy create the DFDs is made possible with Data Flow Diagrams solution from the Software Development area of ConceptDraw Solution Park. For designing the Data Flow Diagrams are used simple DFD flowchart symbols which are connected each other by arrows depicting the data flow from one step to another.- Design elements - Flowchart | Design elements - Sales flowchart ...
- Design elements - Flowchart | IDEF3 Standard | Name Two Type Of ...
- Types of Flowcharts | IDEF3 Standard | IDEF | Different Types Of Idef
- Design elements - Flowchart | Design elements - HR flowchart ...
- Types of Flowcharts | Basic Flowchart Symbols and Meaning ...
- Types of Flowcharts | Flowchart Of The Different Types Of Markets
- Basic Flowchart Symbols and Meaning | Entity Relationship ...
- Use Case Diagrams technology with ConceptDraw PRO | Two ...
- Use Case Diagrams technology with ConceptDraw PRO | IDEF3 ...
- IDEF3 Standard | Branching Two Types Explain In Flow Chart


