Cross-Functional Flowcharts in ConceptDraw

Example of DFD for Online Store (Data Flow Diagram)


UML Component Diagram Example - Online Shopping

Online Diagram Tool

Online Flow Chart

How to create your UML Diagram

Flowchart Maker

How to Create a Social Media DFD Flowchart

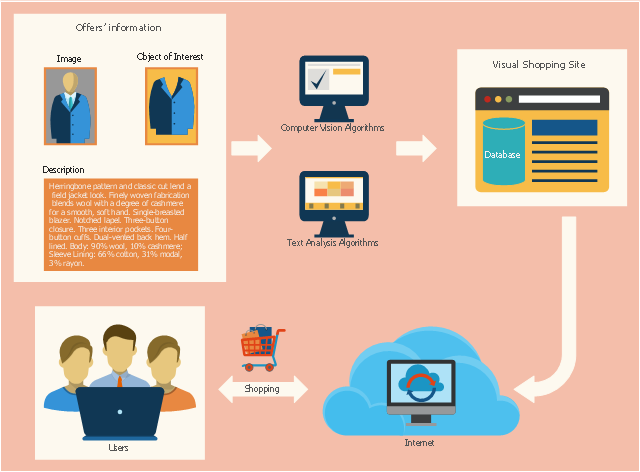
This sales flowchart example was redesigned from the Wikimedia Commons file: Visual shopping scheme.pdf. [commons.wikimedia.org/ wiki/ File:Visual_ shopping_ scheme.pdf]
"Online shopping (sometimes known as e-tail from "electronic retail" or e-shopping) is a form of electronic commerce which allows consumers to directly buy goods or services from a seller over the Internet using a web browser. Alternative names are: e-web-store, e-shop, e-store, Internet shop, web-shop, web-store, online store, online storefront and virtual store. Mobile commerce (or m-commerce) describes purchasing from an online retailer's mobile optimized online site or app." [Online shopping. Wikipedia]
The example "Visual shopping scheme" was created using the ConceptDraw PRO diagramming and vector drawing software extended with the Sales Flowcharts solution from the Marketing area of ConceptDraw Solution Park.
Online shopping flowchart
Stakeholder Management System

State Diagram Example — Online Store

How to Use the ″Online Store PR Campaign″ Sample

UML Composite Structure Diagram


UML Collaboration Diagram (UML2.0)
 *")
Simple Diagramming


Database Flowchart Symbols

Gane Sarson Diagram

Flow Diagrams

UML Class Diagram Example - Apartment Plan

- | Online Shoping Flow Chart And Diagram
- Sales Flowcharts | System Flow Chart From Online Shoping
- Flow Chart Of Online Shopping Website
- Online Shopping System Flow Chart
- Example of DFD for Online Store (Data Flow Diagram) | Sales ...
- Draw System Flow Diagram For Online Shopping System
- Example of DFD for Online Store (Data Flow Diagram) DFD ...
- Shopingflow
- Flow chart Example. Warehouse Flowchart | Example of DFD for ...
- A Mind Map Of Website Online Shoping
- Example of DFD for Online Store (Data Flow Diagram) | UML Use ...
- Work Flow Diagram For Online Shopping Cart
- Block Diagram Of Online Shopping On Virtual Trial Block Diagram
- Example of DFD for Online Store (Data Flow Diagram) | DFD ...
- Information About Online Shoping With Flow Chart Er Diagram And
- Example of DFD for Online Store (Data Flow Diagram) | Online ...
- Data Flow Diagram For Online Shopping Pdf
- UML Notation | Draw A System Flow Diagram For Online Shopping ...
- Fishbone Diagram | How To Make A Chart On Online Shopping