This site uses cookies. By continuing to browse the ConceptDraw site you are agreeing to our Use of Site Cookies.

seven management and planning tools Seven Management and Planning Tools

seven management and planning tools
Seven Management and Planning Tools solution extends ConceptDraw DIAGRAM and ConceptDraw MINDMAP with features, templates, samples and libraries of vector stencils for drawing management mind maps and diagrams.

Sales Dashboard Examples

Visualizing sales data you may need a good example to start. ConceptDraw Sales Dashboard solution delivers a complete set of templates and samples you can use as examples to start composing your own sales dashboard.

Visualize Sales Data Using Sample Data

ConceptDraw DIAGRAM software extended with the Sales Dashboard solution allows you visualize sales data using sample data delivered with the solution to choose visual indicators you need, and then connect these indicators to your real data.

Data Visualization Solutions

Data visualization solutions help you to see how your business can improve. Visualizing sales data using ConceptDraw Sales Dashboard gives you a bird's-eye view of the sale process.

Sales Growth. Bar Graphs Example

This sample was created in ConceptDraw DIAGRAM diagramming and vector drawing software using the Bar Graphs Solution from Graphs and Charts area of ConceptDraw Solution Park. It is Bar Graphs example, Sales Growth example, Column Chart Example - Sales Report.

Online Collaboration via Skype
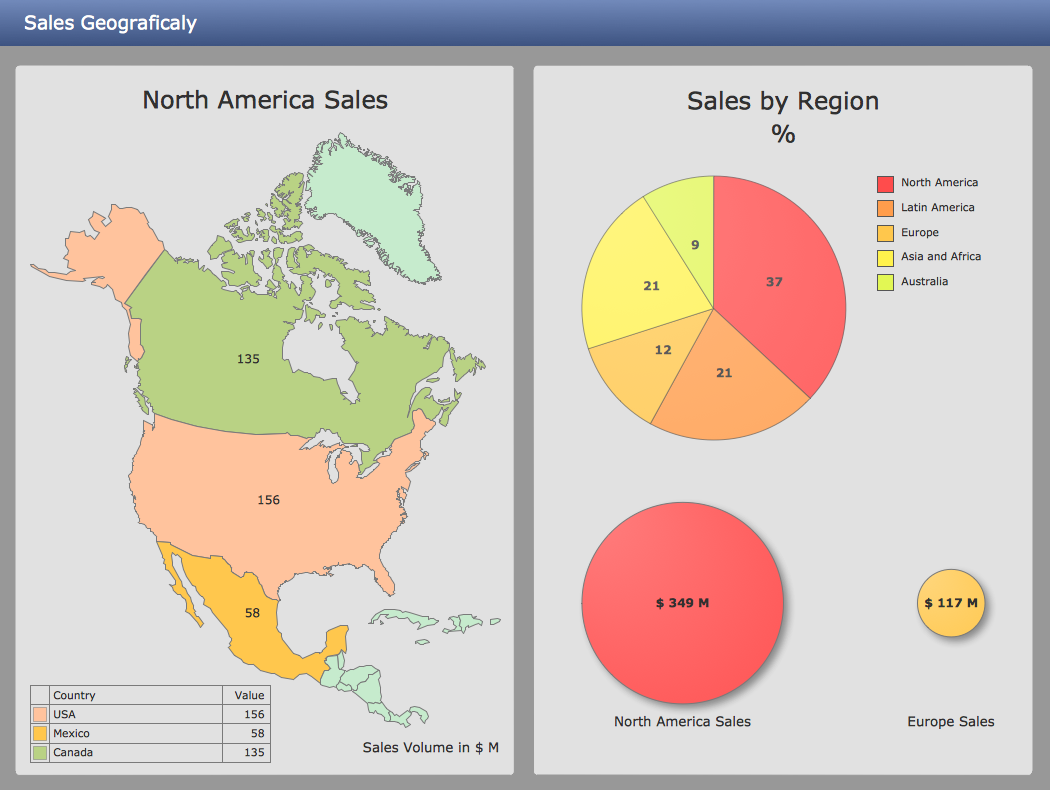
Collaborating with co-workers is very important, not only in order to get things done effectively, but also to keep in touch with the outside world. Great way for business collaboration is Skype.

sales dashboard, sales metrics Sales Dashboard

sales dashboard, sales metrics
Sales Dashboard solution extends ConceptDraw DIAGRAM software with templates, samples and library of vector stencils for drawing the visual dashboards of sale metrics and key performance indicators (KPI).

Sales Dashboard - Access Anywhere

ConceptDraw Sales Dashboard is an automatically updated sales dashboard you can customize to see KPI you need. You can access sales dashboard anywhere to get fresh data and use any minute to see how your business can improve.

Sales Dashboard Template

ConceptDraw DIAGRAM software extended with the Sales Dashboard solution delivers a complete set of samples, templates and pre-designed objects you need for visualizing sales data.

Sales Organization

Sales organization becomes easier when you have proper tools to motivate your team and measure team and personal progress. ConceptDraw Sales Dashboard helps you in sales organization visualizing sales data that gives your team a visual appearance of their progress.

Ways You Can Visualize Sales Data

There are lots of ways you can visualize sales data, and the simplest way is using ConceptDraw Sales Dashboard solution for ConceptDraw DIAGRAM. You just need to connect your data to one of pre-designed dashboards, and then you can see dynamic picture of changes.

A KPI Dashboard

Composing a dashboard from different KPI is a kind of art. Visualizing sales data you have to keep balance to keep your dashboard informative, not messy. ConceptDraw Sales Dashboard solution gives you a set of good examples of balanced dashboards.

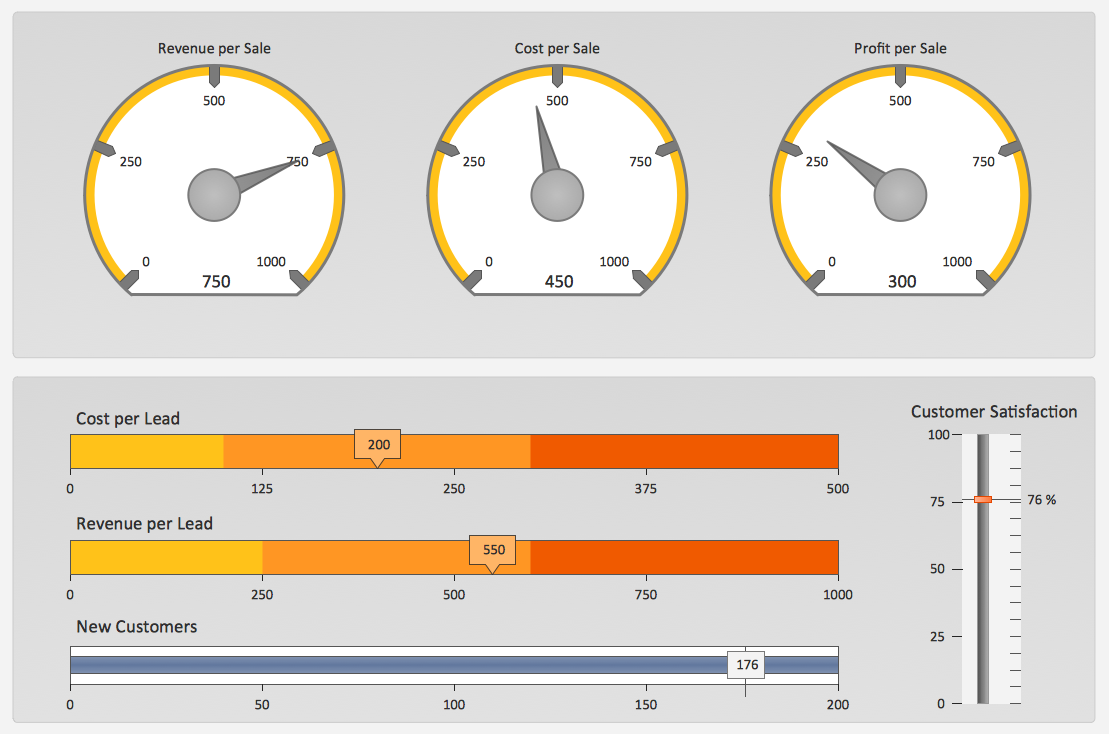
Sales Dashboard Screenshot

ConceptDraw DIAGRAM software exteneded with the Sales Dashboard solution is perfect for visualizing sales data. This is the best tool to analyse your sales perfornance and see how your business can improve.

A KPI Dashboard Provides the Answers Your Sales Team

Sales dashboard is a tool that provides the answers to all questions your sales team may have. A mature sales dashboard provides complete set of KPI to shows corporate, team or personal performance to keep sales process clear.

Sales Dashboard Solutions can help your sales team keep an eye on performance

ConceptDraw Sales Dashboard Solution is a simple and effective way of visualizing sales data and get clear picture of your sales process to see how your business can improve.

Sales Teams are Inherently Competitive

Sales teams are inherently competitive, so you don't need to invent extra ways to stimulate the competition. At the same time, you can provide the team with a sales dashboard shows company, team and personal KPI to make the competition clear.

Empower Your Sales Team With a Sales Dashboard

ConceptDraw Sales Dashboard solution allows you empower your sales team with a sales dashboard that visualizes all team and personal KPI your team need to work effectively.

Marketing and Sales Organization chart. Organization chart Example

This sample was created in ConceptDraw DIAGRAM diagramming and vector drawing software using the Organizational Charts solution from the Management area of ConceptDraw Solution Park.
This sample shows the Organizational Chart that displays the Sales and marketing (CRM) module. Using the ready-to-use predesigned objects, samples and templates from the Organizational Charts Solution for ConceptDraw DIAGRAM you can create your own orgchart professional quick and easy.

Dashboard Software

ConceptDraw PRo is a software that is perfect for creating dynamic dashboards for visualizing sales data. You can match your KPI to pre-designed visual indicators and start tracking your sales performance in real-time.

entity-relationship diagram, ER-diagram, database ERD Entity-Relationship Diagram (ERD)

entity-relationship diagram, ER-diagram, database ERD
Entity-Relationship Diagram (ERD) solution extends ConceptDraw DIAGRAM software with templates, samples and libraries of vector stencils from drawing the ER-diagrams by Chen's and crow’s foot notations.