Management Tools — Total Quality Management

PROBLEM ANALYSIS. Root Cause Analysis Tree Diagram


PDPC

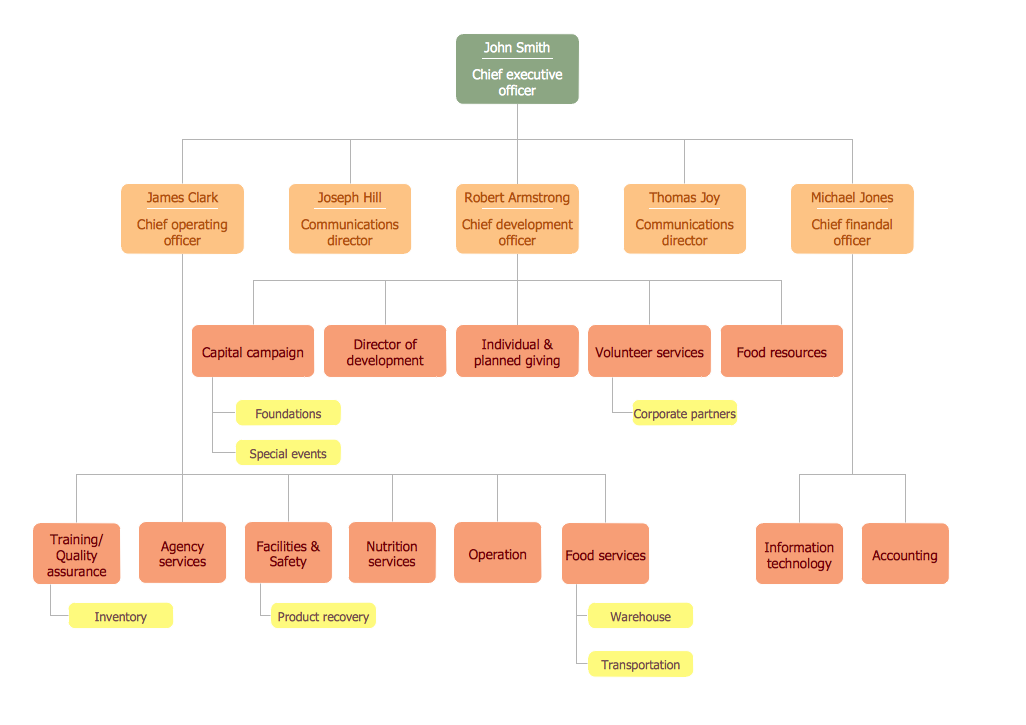
Organigrams with ConceptDraw DIAGRAM
Prioritization Matrix

Create Organizational Chart

 Seven Management and Planning Tools
Seven Management and Planning Tools solution extends ConceptDraw DIAGRAM and ConceptDraw MINDMAP with features, templates, samples and libraries of vector stencils for drawing management mind maps and diagrams.
 Enterprise Architecture Diagrams
Enterprise Architecture Diagrams solution extends ConceptDraw DIAGRAM software with templates, samples and library of vector stencils for drawing the diagrams of enterprise architecture models.
Root Cause Analysis

Stakeholder Onion Diagrams

ConceptDraw DIAGRAM - Organizational chart software

 IDEF Business Process Diagrams
Use the IDEF Business Process Diagrams solution to create effective database designs and object-oriented designs, following the integration definition methodology.
 Line Graphs
How to draw a Line Graph with ease? The Line Graphs solution extends the capabilities of ConceptDraw DIAGRAM with professionally designed templates, samples, and a library of vector stencils for drawing perfect Line Graphs.
 Network Layout Floor Plans
Network Layout Floor Plans solution extends ConceptDraw DIAGRAM software functionality with powerful tools for quick and efficient documentation the network equipment and displaying its location on the professionally designed Network Layout Floor Plans. Never before creation of Network Layout Floor Plans, Network Communication Plans, Network Topologies Plans and Network Topology Maps was not so easy, convenient and fast as with predesigned templates, samples, examples and comprehensive set of vector design elements included to the Network Layout Floor Plans solution. All listed types of plans will be a good support for the future correct cabling and installation of network equipment.
 Bar Graphs
The Bar Graphs solution enhances ConceptDraw DIAGRAM functionality with templates, numerous professional-looking samples, and a library of vector stencils for drawing different types of Bar Graphs, such as Simple Bar Graph, Double Bar Graph, Divided Bar Graph, Horizontal Bar Graph, Vertical Bar Graph, and Column Bar Chart.
- Swot Analysis Example In Healthcare
- Example Of Swot Analysis In Healthcare
- Healthcare Vector
- Mind Maps for Business - SWOT Analysis | Porter's Value Chain ...
- Swot Analysis Examples Health
- Value stream map - Template | Porter's Value Chain | How to Make ...
- Mind Maps for Business - SWOT Analysis | Value stream map ...
- How to Create SWOT Analysis Template Using ConceptDraw PRO ...
- Relations diagram - Health care | Prioritization matrix - Health care ...
- Swot Analysis Example Small Business Pdf
- Porter's value chain diagram - Template
- New business opportunity SWOT analysis matrix - Template portrait ...
- SWOT Matrix Template | UML Activity Diagram | Basic Workflow ...
- How To Create a Prioritization Matrix | Prioritization Matrix ...
- TOWS Matrix | TOWS analysis matrix - Template | SWOT Template ...
- SWOT Analysis | Mind Maps for Business - SWOT Analysis | Small ...
- SWOT Analysis | Swot Analysis Examples | SWOT Matrix Template ...
- Mind Maps for Business - SWOT Analysis | How to Make SWOT ...
- How To Write Personal Swot Analysis Pdf