PROBLEM ANALYSIS. Root Cause Analysis Tree Diagram


Management Tools — Total Quality Management

"The name says it: Strength, Weakness, Opportunity, Threat. A SWOT analysis guides you to identify the positives and negatives inside your organization (S-W) and outside of it, in the external environment (O-T). Developing a full awareness of your situation can help with both strategic planning and decision-making.
The SWOT method (which is sometimes called TOWS) was originally developed for business and industry, but it is equally useful in the work of community health and development, education, and even personal growth.
SWOT is not the only assessment technique you can use, but is one with a long track record of effectiveness. The strengths of this method are its simplicity and application to a variety of levels of operation." [ctb.ku.edu/ en/ table-of-contents/ assessment/ assessing-community-needs-and-resources/ swot-analysis/ main]
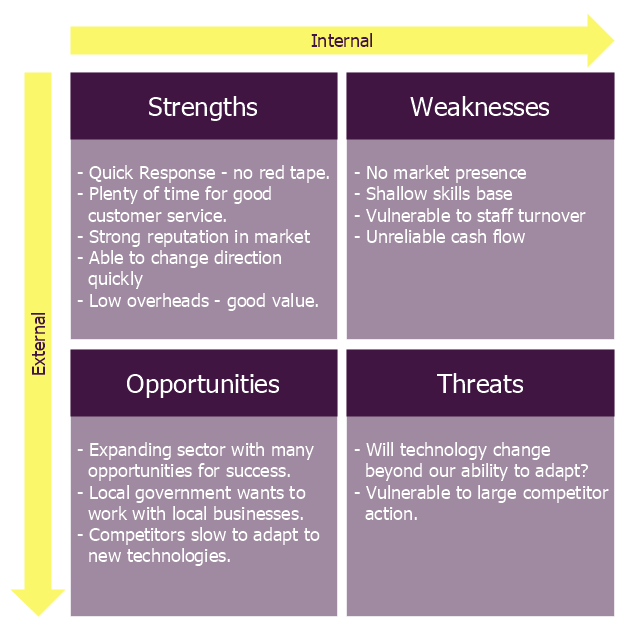
The diagram example "Small business consultancy SWOT analysis matrix" was created using the ConceptDraw PRO diagramming and vector drawing software extended with the SWOT Analysis solution from the Management area of ConceptDraw Solution Park.
The SWOT method (which is sometimes called TOWS) was originally developed for business and industry, but it is equally useful in the work of community health and development, education, and even personal growth.
SWOT is not the only assessment technique you can use, but is one with a long track record of effectiveness. The strengths of this method are its simplicity and application to a variety of levels of operation." [ctb.ku.edu/ en/ table-of-contents/ assessment/ assessing-community-needs-and-resources/ swot-analysis/ main]
The diagram example "Small business consultancy SWOT analysis matrix" was created using the ConceptDraw PRO diagramming and vector drawing software extended with the SWOT Analysis solution from the Management area of ConceptDraw Solution Park.
SWOT matrix
 Seven Management and Planning Tools
Seven Management and Planning Tools solution extends ConceptDraw PRO and ConceptDraw MINDMAP with features, templates, samples and libraries of vector stencils for drawing management mind maps and diagrams.
PDPC

Prioritization Matrix

 Seven Management and Planning Tools
Seven Management and Planning Tools solution extends ConceptDraw PRO and ConceptDraw MINDMAP with features, templates, samples and libraries of vector stencils for drawing management mind maps and diagrams.
 Fault Tree Analysis Diagrams
This solution extends ConceptDraw PRO v9.5 or later with templates, fault tree analysis example, samples and a library of vector design elements for drawing FTA diagrams (or negative analytical trees), cause and effect diagrams and fault tree diagrams.
Affinity Diagram

- Swot Analysis Healthcare Examples
- Example Swot Analysis Healthcare Products
- SWOT Analysis | SWOT analysis for a small independent bookstore ...
- Emergency Plan | SWOT Analysis Solution - Strategy Tools ...
- Relations diagram - Health care | Prioritization matrix - Health care ...
- Seven Management and Planning Tools | Healthcare Software Clipart
- Prioritization matrix - Health care problems | Seven Management ...
- PROBLEM ANALYSIS . Prioritization Matrix | How To Create a ...
- New business opportunity SWOT analysis matrix - Template portrait ...
- Quality function deployment chart - Handheld projector | Quality ...
- Basic Workflow Examples | Floor Plans | 7 tools that should be in ...
- Involvement matrix - SEPP program roles and responsibilities ...
- How To Create a Prioritization Matrix | Prioritization Matrix | Design ...
- Value Chain Analysis Template
- Competitor Analysis | SWOT matrix template | SWOT analysis matrix ...
- Mind Map Exchange | Swot Analysis Examples for Mac OSX ...
- SWOT Analysis | SWOT Analysis Solution - Strategy Tools | SWOT ...
- Seven Management and Planning Tools | Business Productivity ...
- Small business consultancy SWOT analysis matrix | How to Create ...
- Hospital Management Application Flowchart