 SWOT and TOWS Matrix Diagrams
SWOT and TOWS Matrix Diagrams solution extends ConceptDraw PRO and ConceptDraw MINDMAP software with features, templates, samples and libraries of vector stencils for drawing SWOT and TOWS analysis matrices and mind maps.
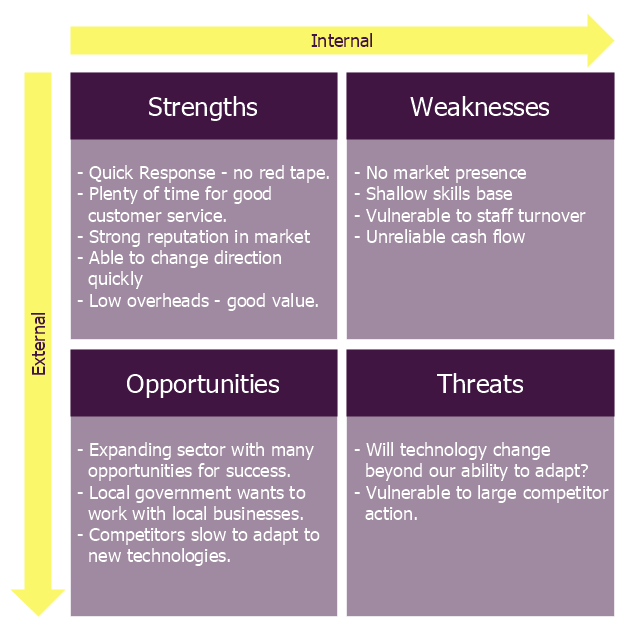
"The name says it: Strength, Weakness, Opportunity, Threat. A SWOT analysis guides you to identify the positives and negatives inside your organization (S-W) and outside of it, in the external environment (O-T). Developing a full awareness of your situation can help with both strategic planning and decision-making.
The SWOT method (which is sometimes called TOWS) was originally developed for business and industry, but it is equally useful in the work of community health and development, education, and even personal growth.
SWOT is not the only assessment technique you can use, but is one with a long track record of effectiveness. The strengths of this method are its simplicity and application to a variety of levels of operation." [ctb.ku.edu/ en/ table-of-contents/ assessment/ assessing-community-needs-and-resources/ swot-analysis/ main]
The diagram example "Small business consultancy SWOT analysis matrix" was created using the ConceptDraw PRO diagramming and vector drawing software extended with the SWOT Analysis solution from the Management area of ConceptDraw Solution Park.
SWOT matrix
PROBLEM ANALYSIS. Root Cause Analysis Tree Diagram


SWOT Matrix Software

Model Based Systems Engineering

 Health Food
The Health Food solution contains the set of professionally designed samples and large collection of vector graphic libraries of healthy foods symbols of fruits, vegetables, herbs, nuts, beans, seafood, meat, dairy foods, drinks, which give powerful possi
PDPC

 Seven Management and Planning Tools
Seven Management and Planning Tools solution extends ConceptDraw PRO and ConceptDraw MINDMAP with features, templates, samples and libraries of vector stencils for drawing management mind maps and diagrams.
Management Tools — Total Quality Management

Prioritization Matrix

Venn Diagram

 Management Area
The solutions from Management area of ConceptDraw Solution Park collect templates, samples and libraries of vector stencils for drawing the management diagrams and mind maps.
 ConceptDraw Solution Park
ConceptDraw Solution Park collects graphic extensions, examples and learning materials
- Swot Analysis Healthcare Examples
- Example Swot Analysis Health And Social Care
- Example Of Swot Analysis In Healthcare
- Swot Example For Health
- Example Of Swot Planning On Health Planning
- New business opportunity SWOT analysis matrix - Template portrait ...
- Swot Analysis Example Gym
- SWOT Analysis | SWOT analysis for a small independent bookstore ...
- Swot Analysis For Small Business Example
- Health Food | Fault Tree Analysis Diagrams | Fishbone Diagrams ...
- Healthy Diet Plan | Healthy Meal Recipes | SWOT analysis matrix ...
- Fishbone Diagrams | Fault Tree Analysis Diagrams | Health Food ...
- How To Create a Prioritization Matrix | PROBLEM ANALYSIS ...
- Food Court | Health Food | Cooking Recipes | Matri Wegitables
- SWOT Analysis Tool for Small Business | Fishbone Diagram ...
- Example Of Spa Swot
- Prioritization matrix - Health care problems | Seven Management ...
- How To Create a Prioritization Matrix | Prioritization Matrix ...
- SWOT Analysis | SWOT analysis for a small independent bookstore ...
- Relations diagram - Health care | Prioritization matrix - Health care ...