 Healthcare Management Workflow Diagrams
Healthcare Management Workflow Diagrams solution contains large set of colorful samples and libraries with predesigned vector pictograms and symbols of health, healthcare equipment, medical instruments, pharmaceutical tools, transport, medication, departments of healthcare organizations, the medical icons of people and human anatomy, as well as the predesigned flowchart objects, connectors and arrows, which make it the best for designing clear and comprehensive Medi?al Workflow Diagrams and Block Diagrams, Healthcare Management Flowcharts and Infographics, Healthcare Workflow Diagram, for depicting the healthcare workflow and clinical workflows in healthcare, for making the workflow analysis healthcare and healthcare workflow management.
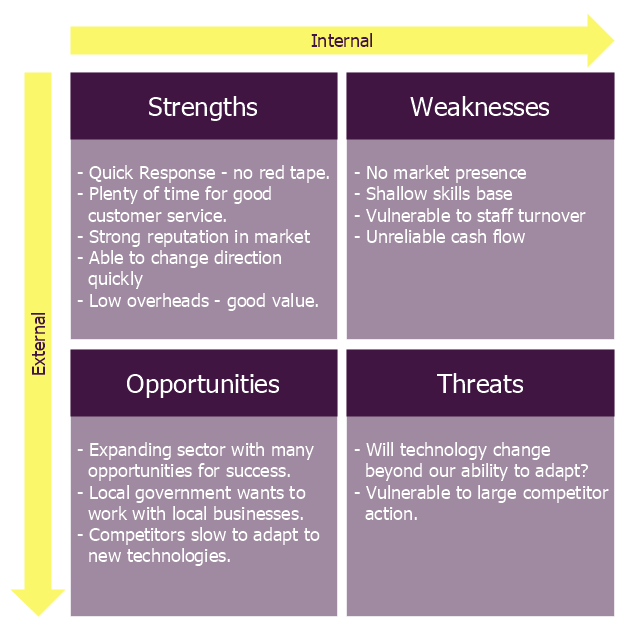
"The name says it: Strength, Weakness, Opportunity, Threat. A SWOT analysis guides you to identify the positives and negatives inside your organization (S-W) and outside of it, in the external environment (O-T). Developing a full awareness of your situation can help with both strategic planning and decision-making.
The SWOT method (which is sometimes called TOWS) was originally developed for business and industry, but it is equally useful in the work of community health and development, education, and even personal growth.
SWOT is not the only assessment technique you can use, but is one with a long track record of effectiveness. The strengths of this method are its simplicity and application to a variety of levels of operation." [ctb.ku.edu/ en/ table-of-contents/ assessment/ assessing-community-needs-and-resources/ swot-analysis/ main]
The diagram example "Small business consultancy SWOT analysis matrix" was created using the ConceptDraw PRO diagramming and vector drawing software extended with the SWOT Analysis solution from the Management area of ConceptDraw Solution Park.
SWOT matrix
Root Cause Analysis


 Pharmacy Illustrations
Pharmacy Illustrations solution with improbable quantity of predesigned vector objects and icons of pharmacy symbols, medical and health products, pharmacy images of drugstore products, pharmacy clipart of medication tools, pharmacy logo, and other pharmacy pictures is the best for designing the pharmacy illustrations of varied kinds, pharmacy and medical diagrams and schematics, for making the presentation slides and posters on the medical, pharmacy, pharmacology and pharmaceutical thematics, for designing the illustrative materials about ways of prevention diseases and also treatment them, for creation colorful illustrations helpful in newborn and baby care, the infographics and collages to be presented at the premises of medical establishments and during the lectures at the medical education institutions, also on the billboards and in other advertising materials.
PDPC

 Seven Management and Planning Tools
Seven Management and Planning Tools solution extends ConceptDraw DIAGRAM and ConceptDraw MINDMAP with features, templates, samples and libraries of vector stencils for drawing management mind maps and diagrams.
 Fishbone Diagrams
The Fishbone Diagrams solution extends ConceptDraw DIAGRAM software with the ability to easily draw the Fishbone Diagrams (Ishikawa Diagrams) to clearly see the cause and effect analysis and also problem solving. The vector graphic diagrams produced using this solution can be used in whitepapers, presentations, datasheets, posters, and published technical material.
Stakeholder Onion Diagrams

PROBLEM ANALYSIS. Identify and Structure Factors

- Swot Analysis Example For Healthcare
- Swot Analysis Examples Health
- How to Create SWOT Analysis Template Using ConceptDraw PRO ...
- Prioritization matrix - Health care problems | Relations diagram ...
- Medicine and health pictograms - Vector stencils library | Relations ...
- Mind Mapmind Map Fishbone Diagram In Healthcare
- Pyramid Chart Examples | Pyramid Diagrams | Medicine and health ...
- Relationships Analysis | CORRECTIVE ACTIONS PLANNING. Risk ...
- SWOT Analysis Software | SWOT Analysis Solution - Strategy Tools ...