This site uses cookies. By continuing to browse the ConceptDraw site you are agreeing to our Use of Site Cookies.

entity-relationship diagram, ER-diagram, database ERD Entity-Relationship Diagram (ERD)

entity-relationship diagram, ER-diagram, database ERD
An Entity-Relationship Diagram (ERD) is a visual presentation of entities and relationships. That type of diagrams is often used in the semi-structured or unstructured data in databases and information systems. At first glance ERD is similar to a flowch

Entity-Relationship Diagram

Entity Relationship Diagram (ERD) is the world-known way to show the logical structure of databases in visual manner. The best software tool for drawing Entity-Relationship Diagram is ConceptDraw DIAGRAM vector graphics software with Entity-Relationship Diagram (ERD) solution from Software Development area which gives the ability to describe a database using the Entity-Relationship model. The vector graphic diagrams produced using this solution can be successfully used in whitepapers, presentations, datasheets, posters, or any technical materials.

Developing Entity Relationship Diagrams

When you need to visually represent the structure of relational database, Entity relationship diagram (ERD) is a type of diagram for that case.
Most entity-relationship diagrams can be built with objects from Flowchart solution or ERD Solution which contains inbuilt templates. Follow these steps to create your own custom ERD diagram.
Don't be frightened if it looks complex, ConceptDraw DIAGRAM makes it easy to create an ERD, and hundreds of other diagrams, in minutes.

ERD Symbols and Meanings

Crow's foot notation is used in Barker's Notation, Structured Systems Analysis and Design Method (SSADM) and information engineering. Crow's foot diagrams represent entities as boxes, and relationships as lines between the boxes. Different shapes at the ends of these lines represent the cardinality of the relationship.
The Chen's ERD notation is still used and is considered to present a more detailed way of representing entities and relationships.
To create an ERD, software engineers mainly turn to dedicated drawing software, which contain the full notation resources for their specific database design - ERD symbols and meanings. CS Odessa has released an all-inclusive Entity-Relationship Diagram (ERD) solution for their powerful drawing program, ConceptDraw DIAGRAM.
How to Build an Entity Relationship Diagram (ERD)

Entity Relationship Diagram Examples

ConceptDraw DIAGRAM diagramming and vector drawing software offers the Entity-Relationship Diagram (ERD) Solution from the Software Development Area for ConceptDraw Solution Park. How many examples contains the Entity-Relationship Diagram (ERD) Solution! All Entity Relationship Diagram examples were designed and saved for ConceptDraw DIAGRAM users. Now they are available from ConceptDraw STORE.

ER Diagram for Cloud Computing

The entity–relationship (ER) model is a data model that lets graphically represent the information system and depict the relationships between people, objects, concepts, places, and events within a given system. It is also convenient to use the ER Diagram for Cloud computing representation and description the Cloud computing architecture, design them with pleasure using the extensive tools of the Cloud Computing Diagrams solution from the Computers and Network area of ConceptDraw Solution Park.

Entity Relationship Diagram Software

The world-best Entity Relationship Diagram software suitable for professional ERD drawing is ConceptDraw DIAGRAM software extended with the Entity-Relationship Diagram (ERD) solution. This solution contains all libraries, templates and samples you may need for professional ERD drawing.

Entity Relationship Diagram Examples

Create an Entity-Relationship (ER) model is to visually represent the structure of a business database, where data equates to entities (or objects) that are linked by defined relationships expressing dependencies and requirements. By nature it is an abstract visualization, the first step in the design process towards creating a logical and functional database.

ConceptDraw DIAGRAM diagramming and vector drawing software gives the ability to describe a database using the Entity-Relationship model. Entity-Relationship Diagram(ERD) solution from the Software Development area supplies the ConceptDraw DIAGRAM with icons advocated by Chen's and Crow’s Foot notation that can be used when describing a database.
How to Build an Entity Relationship Diagram (ERD)

Entity Relationship Diagram - ERD - Software for Design Chen ER Diagrams

The Entity-Relationship Diagram (ERD) solution from ConceptDraw Solution Park extends ConceptDraw DIAGRAM vector graphics and diagramming software with the ability to describe a database using the Entity-Relationship (Chen) model. Use it for design your ERDs and verify that ConceptDraw DIAGRAM offers the best ERD diagrams software tools for design element Chen notation.

Entity-Relationship Diagram (ERD) with ConceptDraw DIAGRAM

Entity-Relationship Diagram (ERD) serves for detailed description of structures and databases. An ERD represents a diagram made up mainly of rectangular blocks (for entities, or data) linked with relationships. The links between the blocks describe relations between these entities. There are three types of relationships: one-to-one,
one-to-many, many-to-many.
Draw Entity-Relationship Diagrams (ERD) easily with ConceptDraw extended with Entity-Relationship Diagram (ERD) Solution from the Software Development Area. Use ERD software to create ER diagram.
How to Build an Entity Relationship Diagram (ERD)

Entity Relationship Diagram Software for Mac

One of the most popular semantic data models is the "entity-relationship" model (often called ER-model). Most of the modern approaches to the database (mainly relational) design are based on the usage of different versions of ER- model. Domain modeling is based on the use of graphic charts, including a small number of heterogeneous components. The simplicity and the presentation clarity of the conceptual basis of these ER-model schemes led to its widespread deployment in the CASE-systems that support automatic design of relational databases.
A relation is a graphically depicted association between two entities. As well as the entity, a relation is a typical concept, all instances of the linked entity types are subject to the rules established by the connecting. Therefore, it is more correct to speak about the relationship type made between types of entities and about the instances of relationship types made between instances of the entity type. In common ER-model this association is a

What's the best ERD tool for the Mac?

What's the best ERD tool for the Mac? ConceptDraw DIAGRAM on Mac OS X supplied with Entity-Relationship Diagram (ERD) Solution from the Software Development Area for ConceptDraw Solution Park is the best ERD tool! This solution offers for ConceptDraw users so powerful drawing tools, libraries with numerous ERD objects, which will help design ER diagrams of any complexity and any design you want.

Entity Relationship Diagrams

The Entity-Relationship Diagram (ERD) Solution from the Software Development Area for ConceptDraw Solution Park extends ConceptDraw DIAGRAM vector graphics and diagramming software with the ability of drawing the Entity Relationship Diagrams for visually describing the databases with Crow’s Foot and Chen's notation icons.

Data Modeling with Entity Relationship Diagram

Data modeling is actively applied in analysis and uses wide set of methods for description the data requirements in a system. One of the most popular and well-known is the ERD method of database modeling.
The best ERD tool for the Mac and Windows is ConceptDraw DIAGRAM software extended with the Entity-Relationship Diagram (ERD) solution from the Software Development Area for ConceptDraw Solution Park, which is sharpened for professional ERD drawing and data modeling with Entity Relationship Diagram.

Entity Relationship Software

Entity Relationship Diagrams (ERD) illustrate the logical structure of databases.
The vector graphic diagrams produced when using the ConceptDraw ERD solution can be used in whitepapers, presentations, datasheets, posters, or any technical materials.
It is convenient to design ER Diagrams using ConceptDraw DIAGRAM software. ConceptDraw DIAGRAM extended with the Entity-Relationship Diagram (ERD) solution supports Chen's and Crow’s Foot notations that are often used to describe database structure.
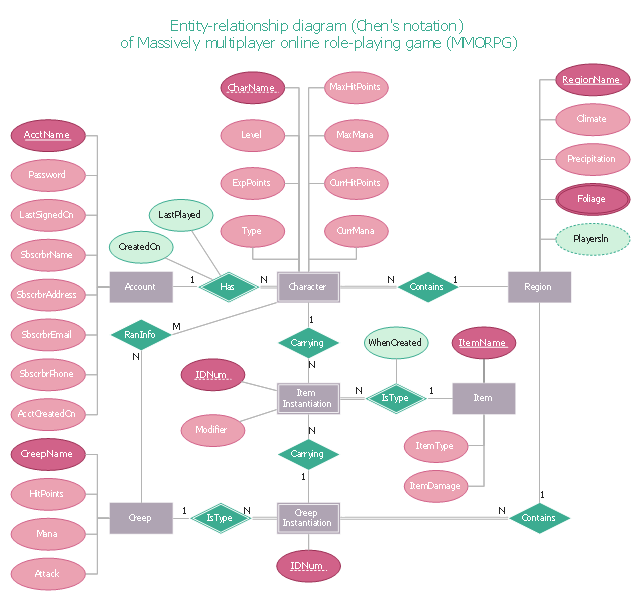
"In software engineering, an entity–relationship model (ER model) is a data model for describing a database in an abstract way.Chen's notation for entity–relationship modeling uses rectangles to represent entity sets, and diamonds to represent relationships appropriate for first-class objects: they can have attributes and relationships of their own. If an entity set participates in a relationship set, they are connected with a line.
Attributes are drawn as ovals and are connected with a line to exactly one entity or relationship set." [Entity–relationship model. Wikipedia]
This sample Chen's ER-diagram illustrates the structure of a typical MMORP game.
"Massively multiplayer online role-playing game (MMORPG) mixes the genres of role-playing video games and Massively multiplayer online games, possibly in the form of web browser-based games, in which a very large number of players interact with one another within a virtual world.
As in all RPGs, players assume the role of a character (often in a fantasy world or science-fiction world) and take control over many of that character's actions. MMORPGs are distinguished from single-player or small multi-player online RPGs by the number of players, and by the game's persistent world (usually hosted by the game's publisher), which continues to exist and evolve while the player is offline and away from the game." [Massively multiplayer online role-playing game. Wikipedia]
This ERD example was redrawn using the ConceptDraw PRO diagramming and vector drawing software from the Wikipedia file: ER Diagram MMORPG.png. [en.wikipedia.org/ wiki/ File:ER_ Diagram_ MMORPG.png]
This file is licensed under the Creative Commons Attribution-Share Alike 3.0 Unported license. [creativecommons.org/ licenses/ by-sa/ 3.0/ deed.en]
This Chen's ERD example is included in the Entity-Relationship Diagram (ERD) solution from the Software Development area of ConceptDraw Solution Park.
Chen's ERD
Chen's ERD, weak key attribute, weak entity, relationship, multivalue attribute, key attribute, identifying relationship, entity, derived attribute, attribute,

Professional Diagram and Flowchart Software

ConceptDraw DIAGRAM is a Mac OS X and Windows platforms professional software to draw your own business process diagrams and flowcharts.

UML Class Diagram Notation

When it comes to system construction, a class diagram is the most widely used diagram. UML Class Diagrams is a type of static structure diagram that is used for general conceptual modeling of the systematics of the application. Such a diagram would illustrate the object-oriented view of a system. The object orientation of a system is indicated by a class diagram. It describes the structure of a system by showing the general issues,classes of a system, attributes, operations, interfaces, inheritance, and the relationships between them.

Software Diagram Examples and Templates

ConceptDraw DIAGRAM is a powerful tool for business and technical diagramming.
Software Development area of ConceptDraw Solution Park provides 5 solutions:
Data Flow Diagrams, Entity-Relationship Diagram (ERD), Graphic User Interface, IDEFO Diagrams, Rapid UML.

MS Visio Look a Like Diagrams

No need for any special drawing skills to create professional looking diagrams outside of your knowledge base. ConceptDraw DIAGRAM takes care of the technical details, allowing you to focus on your job, not the drawing.
ConceptDraw DIAGRAM delivers full-functioned alternative to MS Visio. ConceptDraw DIAGRAM supports import of Visio files. ConceptDraw DIAGRAM supports flowcharting, swimlane, orgchart, project chart, mind map, decision tree, cause and effect, charts and graphs, and many other diagram types.