Accounting Flowchart: Purchasing, Receiving, Payable and Payment

Audit Flowchart Symbols

Program Evaluation and Review Technique (PERT) with ConceptDraw DIAGRAM
 with ConceptDraw DIAGRAM *")
What Is a Circle Spoke Diagram

Diagramming Software for Design UML Object Diagrams


Sales Process Management

It is effective to use professional software for the sales process management. ConceptDraw DIAGRAM diagramming and vector drawing software extended with Sales Flowcharts solution from the Marketing area of ConceptDraw Solution Park is the best choice.
Accounting Cycle Example

Venn Diagram Examples for Problem Solving

Electrical Symbols — Transistors

Seven Basic Tools of Quality — Quality Control

 Accounting Flowcharts
Accounting Flowcharts solution extends ConceptDraw DIAGRAM software with templates, samples and library of vector stencils for drawing the accounting flow charts.
How Do You Make An Accounting Process Flowchart?

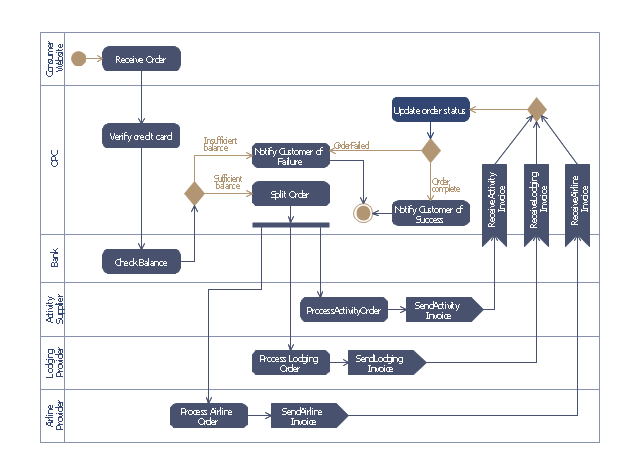
This purchase order processing UML activity diagram was created on the base of activity diagram from the software architecture documentation wiki of the Software Engineering Institute (SEI) of Carnegie Mellon University (CMU).
[wiki.sei.cmu.edu/ sad/ index.php/ Image:PurchaseOrderActivityDiagram.png]
"A purchase order (PO) is a commercial document and first official offer issued by a buyer to a seller, indicating types, quantities, and agreed prices for products or services. Acceptance of a purchase order by a seller forms a contract between the buyer and seller, so no contract exists until the purchase order is accepted. It is used to control the purchasing of products and services from external suppliers.
Creating a purchase order is typically the first step of the purchase to pay process in an ERP system." [Purchase order. Wikipedia]
This purchase order processing UML activity diagram example was created using the ConceptDraw PRO diagramming and vector drawing software extended with the ATM UML Diagrams solution from the Software Development area of ConceptDraw Solution Park.
UML activity diagram of purchase order processing
 SYSML
SYSML
The SysML solution helps to present diagrams using Systems Modeling Language; a perfect tool for system engineering.
 Flowcharts
The Flowcharts solution for ConceptDraw DIAGRAM is a comprehensive set of examples and samples in several varied color themes for professionals that need to represent graphically a process. Solution value is added by the basic flow chart template and shapes' libraries of flowchart notation. ConceptDraw DIAGRAM flow chart creator lets one depict the processes of any complexity and length, as well as design the Flowchart either vertically or horizontally.
Purchasing Flowchart - Purchase Order. Flowchart Examples

 Marketing Diagrams
Marketing Diagrams solution extends ConceptDraw DIAGRAM diagramming software with abundance of samples, templates and vector design elements intended for easy graphical visualization and drawing different types of Marketing diagrams and graphs, including Branding Strategies Diagram, Five Forces Model Diagram, Decision Tree Diagram, Puzzle Diagram, Step Diagram, Process Chart, Strategy Map, Funnel Diagram, Value Chain Diagram, Ladder of Customer Loyalty Diagram, Leaky Bucket Diagram, Promotional Mix Diagram, Service-Goods Continuum Diagram, Six Markets Model Diagram, Sources of Customer Satisfaction Diagram, etc. Analyze effectively the marketing activity of your company and apply the optimal marketing methods with ConceptDraw DIAGRAM software.
 Business Diagrams
The Business Diagrams Solution extends ConceptDraw DIAGRAM with an extensive collection of professionally designed illustrative samples and a wide variety of vector stencils libraries, which are the real help for all business-related people, business analysts, business managers, business advisers, marketing experts, PR managers, knowledge workers, scientists, and other stakeholders allowing them to design the bright, neat, expressive and attractive Bubble Diagrams, Circle-Spoke Diagrams, Circular Arrows Diagrams, and Venn Diagrams with different quantity of sets in just minutes; and then successfully use them in documents, reports, statistical summaries, and presentations of any style.
Basic Flowchart Symbols and Meaning


Design Elements for UML Diagrams

- ERD Symbols and Meanings | Er Diagram Invoice System
- ERD Symbols and Meanings | Entity Relationship Diagram Software ...
- Purchase Order. Flowchart Examples | Procurement Diagram
- Entity - Relationship Diagram (ERD) | Order process - BPMN 2.0 ...
- Global Payment Solutions | Entity - Relationship Diagram (ERD ...
- Example of DFD for Online Store (Data Flow Diagram ) DFD ...
- Procurement process mapping | Pyramid Diagram - Conceptdraw.com
- Entity Relationship Diagram Examples | Design Element: Crows ...
- With The Aid Of Diagram Explain The Purchasing Cycle
- Data Flow Diagrams Shoing The E Procurement Systems
- Data Flow Diagrams (DFD) | Dfd For Purchase Management System
- SYSML | Fishbone Diagram Example On Procurement
- Activity Diagram For Airport Management System
- Project plan timeline | Activity Network Diagram Method | PERT chart
- Example of DFD for Online Store (Data Flow Diagram ) | Global ...
- Purchasing Flowchart - Purchase Order. Flowchart Examples ...
- Data Flow Diagram Process | Accounts Payable Process Flow Chart ...
- Procurement process mapping | Steps in the Accounting Process ...
- Basic Flowchart Symbols and Meaning | Purchase Process Flow ...