This accounting flowchart example was created on the base of the figure illustrating webpage "CHAPTER 4. CONDUCTING AN ADMINISTRATIVE REVIEW" from the website of the Federal Highway Administration (FHWA) of the United States Department of Transportation. [fhwa.dot.gov/ legsregs/ directives/ orders/ toolkita2.htm]
"Business process mapping refers to activities involved in defining what a business entity does, who is responsible, to what standard a business process should be completed, and how the success of a business process can be determined.
The main purpose behind business process mapping is to assist organizations in becoming more efficient. A clear and detailed business process map or diagram allows outside firms to come in and look at whether or not improvements can be made to the current process.
Business process mapping takes a specific objective and helps to measure and compare that objective alongside the entire organization's objectives to make sure that all processes are aligned with the company's values and capabilities." [Business process mapping. Wikipedia]
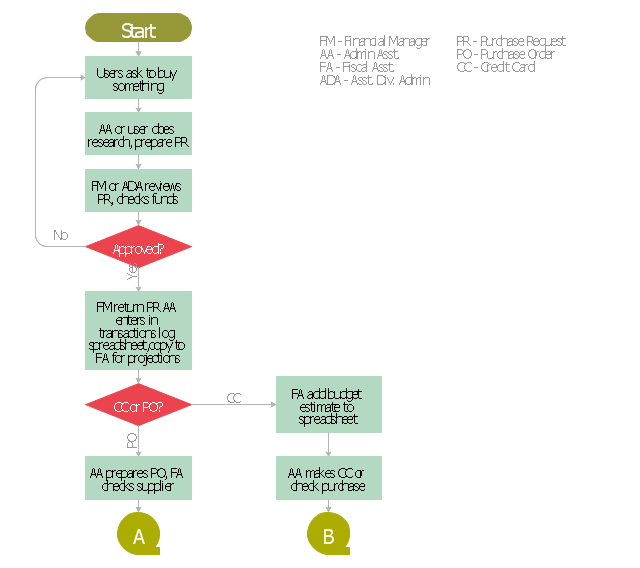
The business process map of procurement process example "Procurement process mapping" was created using the ConceptDraw PRO software extended with the Accounting Flowcharts solution from the Finance and Accounting area of ConceptDraw Solution Park.
"Business process mapping refers to activities involved in defining what a business entity does, who is responsible, to what standard a business process should be completed, and how the success of a business process can be determined.
The main purpose behind business process mapping is to assist organizations in becoming more efficient. A clear and detailed business process map or diagram allows outside firms to come in and look at whether or not improvements can be made to the current process.
Business process mapping takes a specific objective and helps to measure and compare that objective alongside the entire organization's objectives to make sure that all processes are aligned with the company's values and capabilities." [Business process mapping. Wikipedia]
The business process map of procurement process example "Procurement process mapping" was created using the ConceptDraw PRO software extended with the Accounting Flowcharts solution from the Finance and Accounting area of ConceptDraw Solution Park.
Procurement Process Mapping
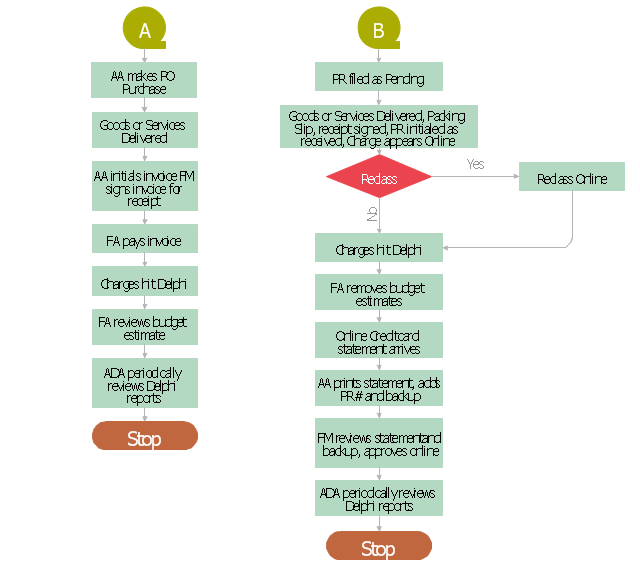
Procurement Mapping Process A, B
UML Business Process

Pyramid Diagram

Identifying Quality Management System

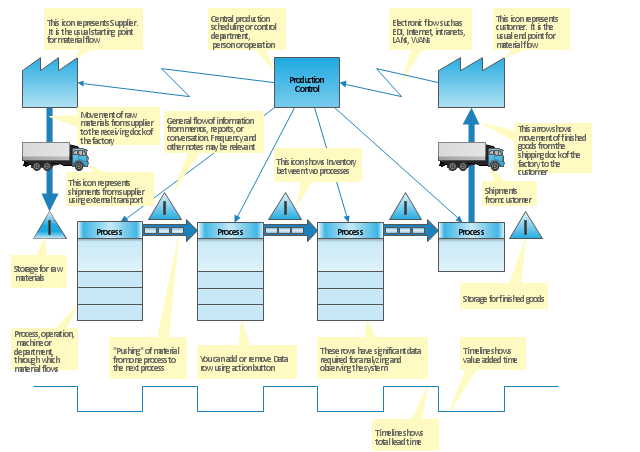
"Value stream mapping is a lean management principle used to analyze and design the flow of materials and information required to bring a product or service to a consumer. Pioneered by Henry Ford in the 1920s, perfected by Toyota. At Toyota, it is known as "material and information flow mapping". It can be applied to nearly any value chain. ...
Value stream mapping has supporting methods that are often used in Lean environments to analyze and design flows at the system level (across multiple processes).
Although value stream mapping is often associated with manufacturing, it is also used in logistics, supply chain, service related industries, healthcare, software development, product development, and administrative and office processes." [Value stream mapping. Wikipedia]
This value stream map template explains the meanings of the VSM design elements.
This Value stream map template for the ConceptDraw PRO diagramming and vector drawing software is included in the Value Stream Mapping solution from the Quality area of ConceptDraw Solution Park.
VSM template
Venn Diagram Examples for Problem Solving

 Event-driven Process Chain Diagrams
Event-driven Process Chain (EPC) Diagram is a type of flowchart widely used for modeling in business engineering and reengineering, business process improvement, and analysis. EPC method was developed within the Architecture of Integrated Information Systems (ARIS) framework.
Model Based Systems Engineering

Pyramid Diagram

A Study of the Business Value of Total Quality Management

Yourdon and Coad Diagram

Bar Diagrams for Problem Solving. Create manufacturing and economics bar charts with Bar Graphs Solution

Material Requisition Flowchart. Flowchart Examples

Best Value — Total Quality Management

Cross-Functional Flowchart


- UML Business Process | Procurement process mapping | Business ...
- Iso 9001 Business Process Mapping
- Swim Lane Flowchart Symbols | Cross-Functional Flowchart (Swim ...
- Process Mapping Wiki
- Business Process Improvement Wiki
- Business Process Wiki
- Payroll process - Swim lane process mapping diagram | Cross ...
- Workforce Flow Mapping Wikipedia
- Swim Lane Diagrams | Payroll process - Swim lane process ...
- Payroll process - Swim lane process mapping diagram | Automated ...
- Payroll process - Swim lane process mapping diagram | Design ...
- Cross-Functional Process Map Template | Business Process ...
- Payroll process - Swim lane process mapping diagram | Swimlane ...
- Process Flowchart | Business Process Mapping — How to Map a ...
- Payroll process - Swim lane process mapping diagram
- Value Stream Mapping Wiki With Example
- Swimlanes Process Map
- Procurement process mapping | Flow chart Example. Warehouse ...
- Process Flowchart | Procurement process mapping | Purchasing ...