This value stream map example was redesigned from the Wikipedia file: ValueStreamMapParts.png.
[en.wikipedia.org/ wiki/ File:ValueStreamMapParts.png]
This file is licensed under the Creative Commons Attribution-Share Alike 3.0 Unported license. [creativecommons.org/ licenses/ by-sa/ 3.0/ deed.en]
"Value stream mapping (VSM) refers to the activity of developing a visual representation of the flow of processes, from start to finish, involved in delivering a desired outcome, service, or product (a “value stream”) that is valued by customers. In the context of government, a value stream could be the process of conducting an audit, completing a procurement, or hiring new agency staff. VSM can increase understanding of actual decision-making processes and identify sources of non-value-added time (e.g., documents waiting to be reviewed). The typical products of a 2-5 day VSM workshop are a map of the “current state” of targeted processes and a “future state” map of the desired process flow and an associated implementation plan for future process improvement activities." [en.wikibooks.org/ wiki/ Business_ Analysis_ Guidebook/ LEAN]
The VSM diagram example "Value stream map parts" was created using the ConceptDraw PRO diagramming and vector drawing software extended with the Value Stream Mapping solution from the Quality area of ConceptDraw Solution Park.
Value stream mapping

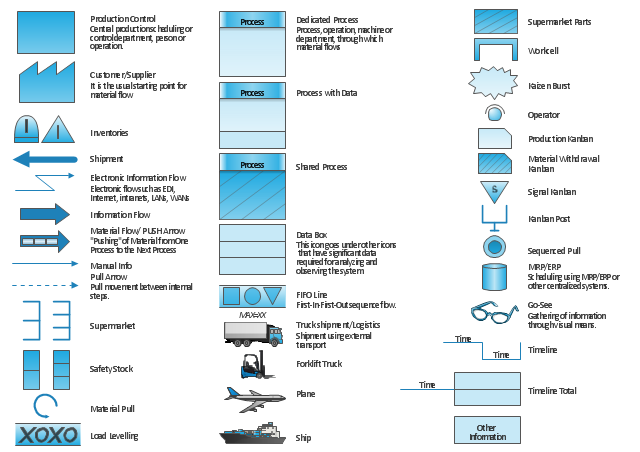
"Value stream mapping usually employs standard symbols to represent items and processes, therefore knowledge of these symbols is essential to correctly interpret the production system problems." [Value stream mapping. Wikipedia]
The vector stencils library Value stream mapping contains 43 symbols for drawing the value stream mapping diagrams using the ConceptDraw PRO diagramming and vector drawing software.
The example "Design elements - Value stream mapping diagram" is included in the Value Stream Mapping solution from the Quality area of ConceptDraw Solution Park.
VSM symbols
VSM

 People
This solution extends ConceptDraw PRO software with samples, templates and libraries of vector clipart for drawing the People illustrations. Use it to make professional-looking documents, presentations and websites illustrated with color scalable vector c
Venn Diagram Examples for Problem Solving. Venn Diagram as a Truth Table

Venn Diagram Examples for Problem Solving. Environmental Social Science. Human Sustainability Confluence

Create your Venn diagrams for problem solving in environmental social science using the ConceptDraw PRO diagramming and vector drawing software extended with the Venn Diagrams solution from the area "What is a Diagram" of ConceptDraw Solution Park.
 Winter Sports
The Winter Sports solution from Sport area of ConceptDraw Solution Park contains winter sports illustration examples, templates and vector clipart libraries.
Venn Diagram Examples for Problem Solving . Quantum Information Science. BQP Complexity

Seven Basic Tools of Quality - Quality Control

Total Quality Management

Quality Management System

 Entity-Relationship Diagram (ERD)
Entity-Relationship Diagram (ERD) solution extends ConceptDraw PRO software with templates, samples and libraries of vector stencils from drawing the ER-diagrams by Chen's and crow’s foot notations.
Venn Diagram Examples for Problem Solving. Computer Science. Chomsky Hierarchy

The Venn diagram example below visualizes the the class of language inclusions described by the Chomsky hierarchy.
 Ice Hockey
The Ice Hockey Solution extends the capabilities of ConceptDraw PRO v9.5 (or later) with samples, templates, and libraries of vector objects for drawing hockey diagrams, plays schemas, and illustrations. The Ice Hockey Solution can be used to make polishe
 Spatial Infographics
Spatial infographics solution extends ConceptDraw PRO software with infographic samples, map templates and vector stencils libraries with design elements for drawing spatial information graphics.
- Value Stream Mapping Symbols | Design elements - Value stream ...
- Value stream map example
- Value Stream Mapping Template
- Value Stream Mapping | Value stream map example | Value stream
- Value stream map parts
- Value stream map example
- Event-driven Process Chain Diagrams EPC | Value stream map ...
- Value stream map example
- Purchasing Flowchart - Purchase Order. Flowchart Examples ...
- Conceptual diagram of the Kanban System | Value stream mapping ...
- Evacuation plan | Value stream map parts | Plan Vs Actual P
- Value Stream Mapping Symbols | Design elements - Value stream ...
- Lean Manufacturing Diagrams | Value Stream Mapping for the Lean ...
- Business Process Mapping — How to Map a Work Process | How to ...
- Lean Value Stream Map
- Value Stream Mapping | Mind Mapping in the Quality Management ...
- Value Stream Mapping
- Value Stream Mapping | How to Create a VSM Diagram Using a ...
- Logistics - Choreography BPMN 2.0 diagram | Logistics ...
- LLNL Flow Charts | Material Requisition Flowchart. Flowchart ...