This site uses cookies. By continuing to browse the ConceptDraw site you are agreeing to our Use of Site Cookies.

Entity Relationship Software

Entity Relationship Diagrams (ERD) illustrate the logical structure of databases.
The vector graphic diagrams produced when using the ConceptDraw ERD solution can be used in whitepapers, presentations, datasheets, posters, or any technical materials.
It is convenient to design ER Diagrams using ConceptDraw DIAGRAM software. ConceptDraw DIAGRAM extended with the Entity-Relationship Diagram (ERD) solution supports Chen's and Crow’s Foot notations that are often used to describe database structure.

Entity Relationship Diagram Examples

Create an Entity-Relationship (ER) model is to visually represent the structure of a business database, where data equates to entities (or objects) that are linked by defined relationships expressing dependencies and requirements. By nature it is an abstract visualization, the first step in the design process towards creating a logical and functional database.

ConceptDraw DIAGRAM diagramming and vector drawing software gives the ability to describe a database using the Entity-Relationship model. Entity-Relationship Diagram(ERD) solution from the Software Development area supplies the ConceptDraw DIAGRAM with icons advocated by Chen's and Crow’s Foot notation that can be used when describing a database.
How to Build an Entity Relationship Diagram (ERD)

Entity Relationship Diagram Symbols

Creating an entity-relationship (ER) model is to visually represent the structure of a business database, where data equates to entities (or objects) that are linked by defined relationships expressing dependencies and requirements. By nature it is an abstract visualization, the first step in the design process towards creating a logical and functional database.
ERD symbols used for professional ERD drawing are collected in libraries from the Entity-Relationship Diagram (ERD) solution for ConceptDraw DIAGRAM.

Business Process Mapping — How to Map a Work Process

ConceptDraw DIAGRAM is a world-class diagramming platform that lets you display, communicate, and present dynamically. It′s powerful enough to draw everything from basic flowcharts to complex engineering schematics.
Video tutorials on ConceptDraw products. Try it today!

Employment Form Software

Basic Diagramming Solution contains a wide set of the ready-to-use vector stencils and professional predesigned employment forms and diagrams. These employment forms will help you in the process of management, recruiting and hiring the employees.
It's very easy and convenient to use the employment form templates from the Basic Diagramming Solution for ConceptDraw DIAGRAM as the base for creating your own employment forms.

Entity Relationship Diagram Software Engineering

Entity Relationship Diagram (aka ERD, ER Diagram, E-R Diagram) is a well-tried software engineering tool for data modeling, system design and illustrating the logical structure of databases.
Professional ERD drawing is an essential software engineering method for database modeling. ConceptDraw DIAGRAM as a powerful Entity Relationship Diagram Software Engineering offers the tools of Entity-Relationship Diagram (ERD) solution from Software Development area of ConceptDraw Solution Park.

ER Diagram Tool

Creating of Entity-Relationship Diagrams (ERDs) is a complex process that requires convenient, automated tools. ConceptDraw DIAGRAM diagramming and vector drawing software offers a powerful ER Diagram Tool - the Entity-Relationship Diagram (ERD) Solution from the Software Development Area.

Developing Entity Relationship Diagrams

When you need to visually represent the structure of relational database, Entity relationship diagram (ERD) is a type of diagram for that case.
Most entity-relationship diagrams can be built with objects from Flowchart solution or ERD Solution which contains inbuilt templates. Follow these steps to create your own custom ERD diagram.
Don't be frightened if it looks complex, ConceptDraw DIAGRAM makes it easy to create an ERD, and hundreds of other diagrams, in minutes.

Entity Relationship Diagram Software

Entity Relationship Diagram (aka ERD, ER Diagram, E-R Diagram) is a well-tried software engineering tool for illustrating the logical structure of databases. Professional ERD drawing is an essential software engineering method for database modeling. Use powerful tools of ConceptDraw DIAGRAM Entity Relationship Diagram Software extended with Entity-Relationship Diagram (ERD) Solution.

CORRECTIVE ACTIONS PLANNING. Risk Diagram (PDPC)

Risk Diagram (PDPC) - ConceptDraw OFFICE suite is a software for Risks Diagram making. This diagram identifies possible risks in accomplishing corrective actions. With the Risks Diagram, one analyzes each action separately in a tree of all actions and develops a preventive action in response of each potential obstacles or circumstances which may be a risk.
7MP Tools
7MP Tools

Entity Relationship Diagram Software for Mac

One of the most popular semantic data models is the "entity-relationship" model (often called ER-model). Most of the modern approaches to the database (mainly relational) design are based on the usage of different versions of ER- model. Domain modeling is based on the use of graphic charts, including a small number of heterogeneous components. The simplicity and the presentation clarity of the conceptual basis of these ER-model schemes led to its widespread deployment in the CASE-systems that support automatic design of relational databases.
A relation is a graphically depicted association between two entities. As well as the entity, a relation is a typical concept, all instances of the linked entity types are subject to the rules established by the connecting. Therefore, it is more correct to speak about the relationship type made between types of entities and about the instances of relationship types made between instances of the entity type. In common ER-model this association is a

3 Circle Venn. Venn Diagram Example

This example shows the 3 Circle Venn Diagram. The Venn Diagrams visualize all possible logical intersections between several sets. On this example you can see the intersections of 3 sets. Venn Diagrams are widely used in mathematics, logic, statistics, marketing, sociology, etc.

Customer Relationship Management

Customer relationship management is an important component of sales success. Visualizing sales data you may put some KPI related to customers relationship management to your Sales dashboard and track this important aspect in real time.

E-R Diagrams

Complexity of databases increases day by day, due to this the Entity relationship models and E-R diagrams become more and more popular, and now are an important part of database design. E-R diagrams created at ConceptDraw DIAGRAM allow visually and graphically represent structure and design of databases.

Business Process Modeling Tools

ConceptDraw DIAGRAM the best business process modeling tools.contains pre-designed libraries and templates based on the BPMN 2.0 standard that allows to create of both simple and complex (nested) models of processes.

Entity Relationship Diagram - ERD - Software for Design Crows Foot ER Diagrams

Crow's Foot notation was proposed by Gordon Everest. According to this notation, the entity is represented by rectangle, relation is depicted by line which ties two entities involved in a relationship. Entity-relationship diagrams based on both Chen's and Crow's Foot notations, can be easily drawn using the ConceptDraw DIAGRAM ERD diagrams software tools for design element Crow's Foot and Chen from Entity-Relationship Diagram (ERD) solution.
How to Build an Entity Relationship Diagram (ERD)

Business Process Modeling with EPC

Event-Driven Process Chain Diagrams for improvement throughout an organisation.
ConceptDraw DIAGRAM - software that reduces the time needed to create a business process model.

Property Management Examples

This sample was created in ConceptDraw DIAGRAM diagramming and vector drawing software using the Seven Management and Planning Tools Solution from the Business Productivity area of ConceptDraw Solution Park.
This sample shows the Property Management matrix, the ideas are ordered in regards to importance and frequency. This matrix gives the ability to turn the theory into quantifiable data.

How to Help Customers be More Productive

Presenting you with a drawing program which could really surprise you with their great functionality.

Don't know how to start to draw Connector's improvement?
Curious how should diagramming software work?

Drawing programs involve a lot of things like designs in an illustrative way, creating an cherts, Tools to create high end graphics, create dashboards, using your data and many other technical aspects do it in a much professional and in a quick way.
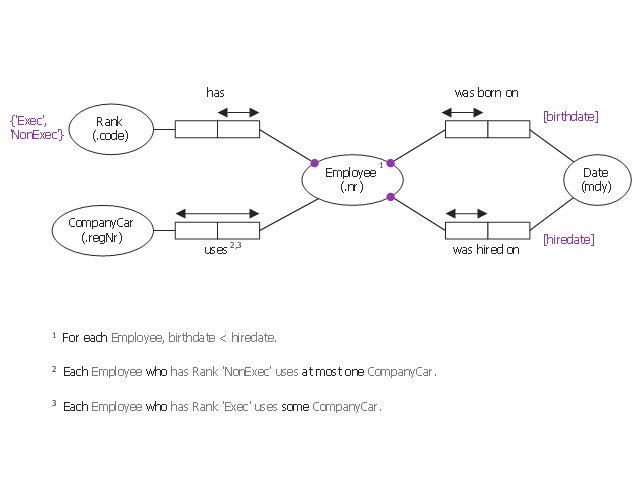
This object-role modeling (ORM) diagram sample shows model of employee data: birthdate, hiredate, rank, company car number. It was designed on the base of the Wikimedia Commons file: ORM-diagram-tkz-orm.png. [commons.wikimedia.org/ wiki/ File:ORM-diagram-tkz-orm.png]
"Facts.
Object-role models are based on elementary facts, and expressed in diagrams that can be verbalised into natural language. ...
This "fact-based" approach facilitates modeling, transforming, and querying information from any domain. ...
Attribute-free.
ORM is attribute-free: unlike models in the entity–relationship (ER) and Unified Modeling Language (UML) methods, ORM treats all elementary facts as relationships and so treats decisions for grouping facts into structures (e.g. attribute-based entity types, classes, relation schemes, XML schemas) as implementation concerns irrelevant to semantics. By avoiding attributes in the base model, ORM improves semantic stability and enables verbalization into natural language. ...
Fact-based modeling.
Fact-based modeling includes procedures for mapping facts to attribute-based structures, such as those of ER or UML. ...
Fact-based graphical notations are more expressive than those of ER and UML. ...
Design procedure.
System development typically involves several stages such as: feasibility study; requirements analysis; conceptual design of data and operations; logical design; external design; prototyping; internal design and implementation; testing and validation; and maintenance." [Object-role modeling. Wikipedia]
The object-role modeling diagram example "Employee ORM diagram" was designed using ConceptDraw PRO software extended with ORM Diagrams solution from Software Development area of ConceptDraw PRO Solution Park.
Object-role model
Object-role model, uniqueness constraint, role connector, mandatory constraint, entity, ORM diagrams, object-role modeling, binary predicate, binary association,