 Entity-Relationship Diagram (ERD)
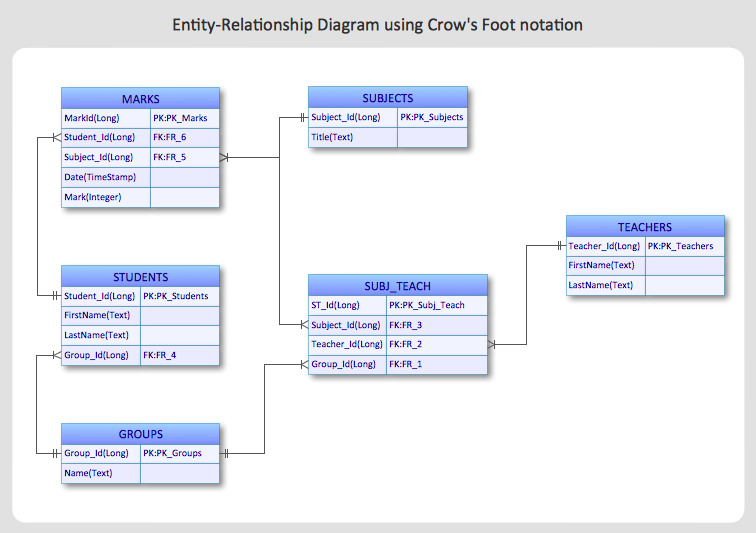
An Entity-Relationship Diagram (ERD) is a visual presentation of entities and relationships. That type of diagrams is often used in the semi-structured or unstructured data in databases and information systems. At first glance ERD is similar to a flowch
 ConceptDraw Solution Park
ConceptDraw Solution Park collects graphic extensions, examples and learning materials
HelpDesk
How to Create an Entity-Relationship Diagram Using ConceptDraw Solution Park
An entity-relationship diagram (ERD)is used in a database modeling process. ERD diagram shows a graphical representation of objects or concepts within an information system and their relationships.The ability to describe a database using the Entity-Relationship model is delivered by the ConceptDraw ERD solution.HelpDesk
How to Create an ERD Diagram
ERD (entity relationship diagram) is used to show the logical structure of databases. It represents the interrelationships between components of database (entities). Entity relationship diagrams are a widely used in software engineering. Using ERD software engineers can control the every aspect of database development. ER diagram can be used as guide for testing and communicating before the release of software product. ERD displays data as entities that are connected with connections that show the relationships between entities. There is some ERD notations used by data bases developers for representing the relationships between the data objects. ConceptDraw PRO and its ERD solution allow you to build ERD diagram of any notation.
 Accounting Flowcharts
Accounting Flowcharts solution extends ConceptDraw PRO software with templates, samples and library of vector stencils for drawing the accounting flow charts.
 Accounting Flowcharts
Accounting Flowcharts solution extends ConceptDraw PRO software with templates, samples and library of vector stencils for drawing the accounting flow charts.
HelpDesk
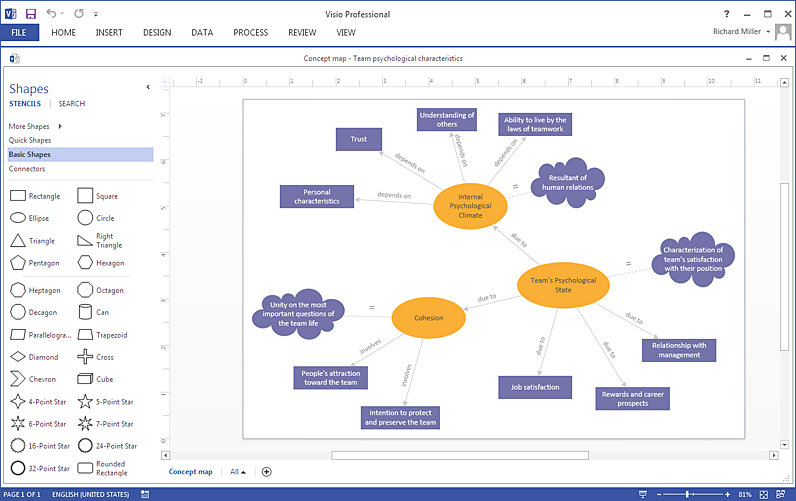
How To Create a Concept Map in Visio Using ConceptDraw PRO
ConceptDraw PRO allows you to easily create concept maps and then make a MS Visio file from your diagrams in a few simple steps.
 Cross-Functional Flowcharts
Cross-functional flowcharts are powerful and useful tool for visualizing and analyzing complex business processes which requires involvement of multiple people, teams or even departments. They let clearly represent a sequence of the process steps, the order of operations, relationships between processes and responsible functional units (such as departments or positions).
 Audit Flowcharts
Audit flowcharts solution extends ConceptDraw PRO software with templates, samples and library of vector stencils for drawing the audit and fiscal flow charts.
HelpDesk
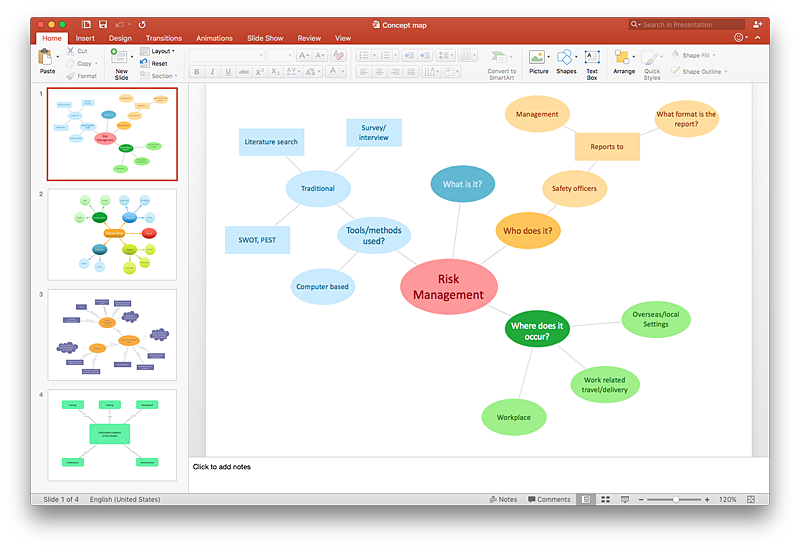
How to Add a Concept Map to a PowerPoint Presentation Using ConceptDraw PRO
Concept maps visually present the relationships among a set of a logically connected items. ConceptDraw PRO allows you to draw concept maps using the Concept Map solution. The PowerPoint presentation of key concept points can be very informative and helpful.HelpDesk
How to Create a Data Flow Diagram using ConceptDraw PRO
Data flow diagramming is a highly effective technique for showing the flow of information through a system. Data flow diagrams reveal relationships among and between the various components in a program or system. DFD is an important technique for modeling a system’s high-level detail by showing how input data is transformed to output results through a sequence of functional transformations. The set of standard symbols is used to depict how these components interact in a system. ConceptDraw PRO allows you to draw a simple and clear Data Flow Diagram using special libraries.
 HR Flowcharts
Human resource management diagrams show recruitment models, the hiring process and human resource development of human resources.
HelpDesk
How to Create a Timeline Diagram in ConceptDraw PRO
A Timeline is a chart which displays a project plan schedule in chronological order. A Timeline is used in project management to depict project milestones and visualize project phases, and show project progress. The graphic form of a timeline makes it easy to understand critical project milestones, such as the progress of a project schedule. Timelines are particularly useful for project scheduling or project management when accompanied with a Gantt chart. It captures the main of what the project will accomplish and how it will be done. making a project timeline is one of the most important skills a project manager needs have. Making comprehensive, accurate timelines allows you getting every project off in the best way. ConceptDraw PRO allows you to draw a timeline charts using special library.
 Sales Flowcharts
The Sales Flowcharts solution lets you create and display sales process maps, sales process workflows, sales steps, the sales process, and anything else involving sales process management.
 Flowcharts
The Flowcharts Solution for ConceptDraw PRO v10 is a comprehensive set of examples and samples in several different color themes for professionals that need to graphically represent a process. Solution value is added by basic flow chart template and shapes' library of Flowchart notation. ConceptDraw PRO flow chart creator lets one depict a processes of any complexity and length, as well design of the flowchart either vertically or horizontally.
- Entity Relationship Diagram Symbols and Meaning ERD Symbols ...
- Cross-Functional Flowcharts | Functional Block Diagram | Cross ...
- Data Flow Diagram Symbols. DFD Library | Entity Relationship ...
- Database Flowchart Symbols | Basic Flowchart Symbols and ...
- Entity Relationship Diagram Software Engineering | Examples of ...
- Chart Maker for Presentations | Flow Chart Creator | Entity ...
- Accounting Flowcharts | Entity - Relationship Diagram (ERD ...
- Basic Flowchart Symbols and Meaning | Entity Relationship ...
- Fishbone Diagram | Entity - Relationship Diagram (ERD) | Cross ...
- Event-driven Process Chain Diagrams EPC | Entity Relationship ...
- Accounting Flowcharts | Fishbone Diagram | Entity - Relationship ...
- Basic Flowchart Symbols and Meaning | Entity Relationship ...
- Business Productivity Diagramming | Entity Relationship Diagram ...
- Entity Relationship Diagram Symbols and Meaning ERD Symbols ...
- Entity Relationship Diagram Software for Mac | Create Flow Chart on ...
- Flowchart design. Flowchart symbols, shapes, stencils and icons ...
- Process Flowchart | Accounting Flowcharts | Entity - Relationship ...
- Entity Relationship Diagram For Exercise And Solution
- Business Productivity Diagramming | Entity Relationship Diagram ...
- Entity - Relationship Diagram (ERD) | Process Flowchart | How to ...


