This site uses cookies. By continuing to browse the ConceptDraw site you are agreeing to our Use of Site Cookies.

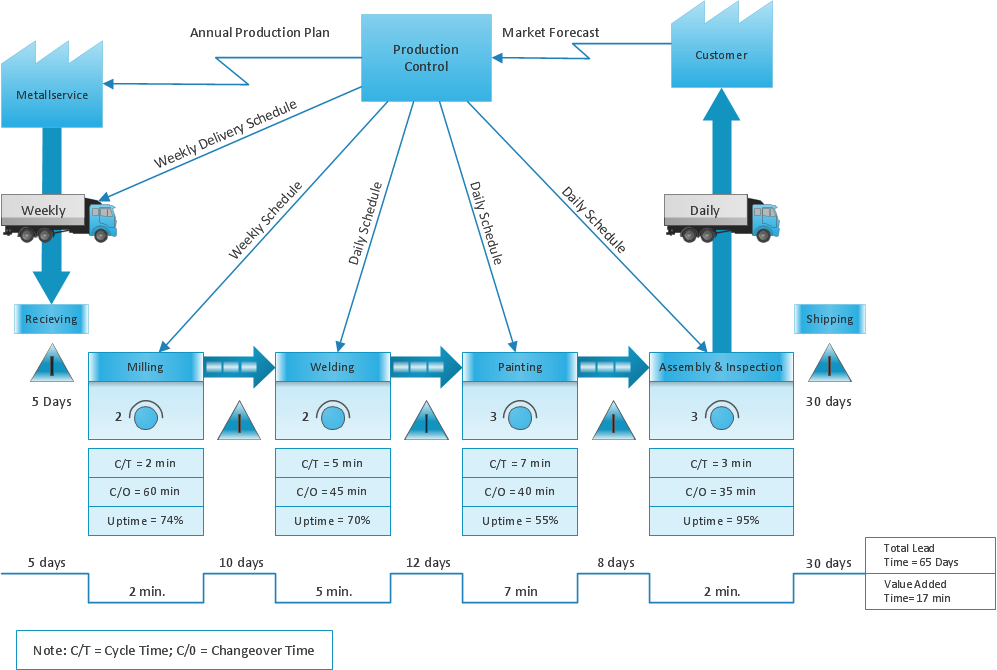
The Lean Enterprise Value Stream Mapping

Create value stream maps - for value stream analysis and value stream management, material and information flow mapping, using our quick start templates included with ConceptDraw.

Business process Flow Chart — Event-Driven Process chain (EPC) diagrams

Event-Driven Process chain Diagrams for improvement throughout an organisation. Best software for Process Flow Diagram. The Event-driven Process Chain (EPC) Diagrams allows managers to plan processes and resources.

Data Flow Diagram Model

The DFD (Yourdon and Coad notation) example "Model of small traditional production enterprise" below was created using the ConceptDraw DIAGRAM diagramming and vector drawing software extended with the Data Flow Diagrams solution from the Software Development area of ConceptDraw Solution Park.
HelpDesk

How to Create an Enterprise Architecture Diagram

An Enterprise Architecture (EA) diagram is used to display the structure and operations of an organization. It is used to analyze and document an organization and its business functions, along with the applications and systems on which they are implemented. The aim of an enterprise architecture diagram is to determine how an organization can effectively achieve its current and future objectives. The Enterprise Architecture often uses diagrams to support the decision-making process. ConceptDraw DIAGRAM allows you to design Enterprise Architecture diagrams of any complexity.

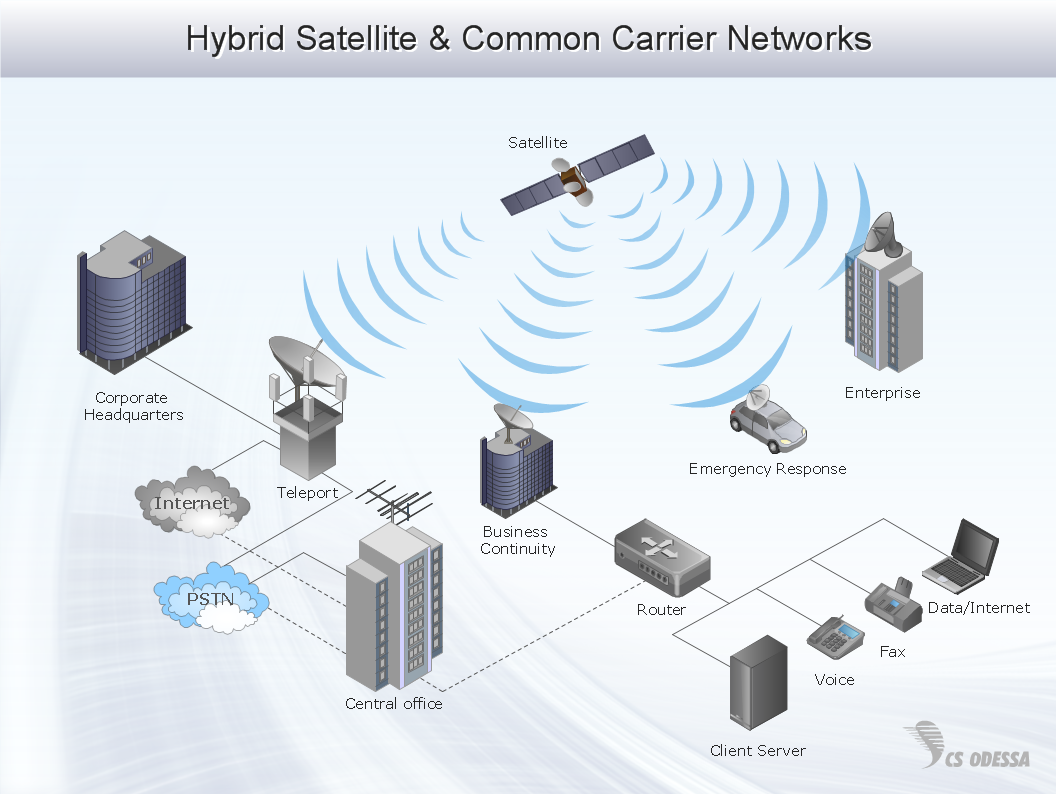
Network Diagram Software Enterprise Private Network

ConceptDraw - Perfect Network Diagramming Software with abundant examples and templates. ConceptDraw Network Diagram is ideal for network engineers and network designers who need to draw Enterprise Private Network diagrams.

Workflow Diagram

Workflow diagram visually describes an repeatable pattern of organizational activity powered by resources. Workflow diagram explains and document the process flow which needs to be organized or exists and needs to be learned and executed. Workflow diagram can be part of project documentation, company policies or sertification process to comply a standard.

The workflow represents the transferring of data, documents or tasks during a work process. To make it easier to study and analyze working processes, and to present them in a simple visual manner, workflow diagrams are used. To create these diagrams professional use workflow diagram maker software ConceptDraw DIAGRAM.

EPC for Configuring an Enterprise Resource Planning

Event-Driven Process Chain Diagrams for improvement throughout an organisation.
ConceptDraw DIAGRAM - software that reduces the time needed to create a business process model.

The Best Tool for Business Process Modeling

The EPC diagram shows various business processes in terms of work flows.
Event-Driven Process chain Diagrams for improvement throughout an organisation.
ConceptDraw DIAGRAM - software that reduces the time needed to create a business process model and is great business process improvement tools.

enterprise architecture diagram, business architecture Enterprise Architecture Diagrams

enterprise architecture diagram, business architecture
Enterprise Architecture Diagrams solution extends ConceptDraw DIAGRAM software with templates, samples and library of vector stencils for drawing the diagrams of enterprise architecture models.

Business Process Flowchart Symbols

The business process flowchart symbols used for business process mapping are predefined by Business Process Modeling Notation (BPMN) and actually have their roots in the data processing diagrams and programming flow charts. Business Process flowchart symbols provide drawing business process flowcharts, diagrams and maps of any complexity.

Business Process Modeling Software for Mac

ConceptDraw DIAGRAM - business process modeling software for mac offers the Business Process Diagram Solution with powerful tools to help you easy represent the business processes and create the business process diagrams based on BPMN 1.2 and BPMN 2.0 standards that allows to create of both simple and complex (nested) models of processes.
There are 16 BPMN 1.2 and BPMN 2.0 stencil libraries containing 230 vector objects: Rapid Draw library, Connections library, Gateways and Artifacts libraries, Data library, Gateways library, Choreographies library, Conversations library, Activities libraries, Events libraries, Expanded Objects libraries, Swim lanes libraries.

Formalization and Verification of Event-driven Process chain

EPC or The Event - driven Process Chain diagrams that provide Enterprise Resource Planning improvement.

ConceptDraw DIAGRAM - software that reduces the time needed to create a business process model.

Decision Making Software For Small Business

A software tool that saves your time on making decisions now has the ability to make decisions with remote team via Skype.

event-driven process chain diagram, EPC diagram, process chain flowchart 
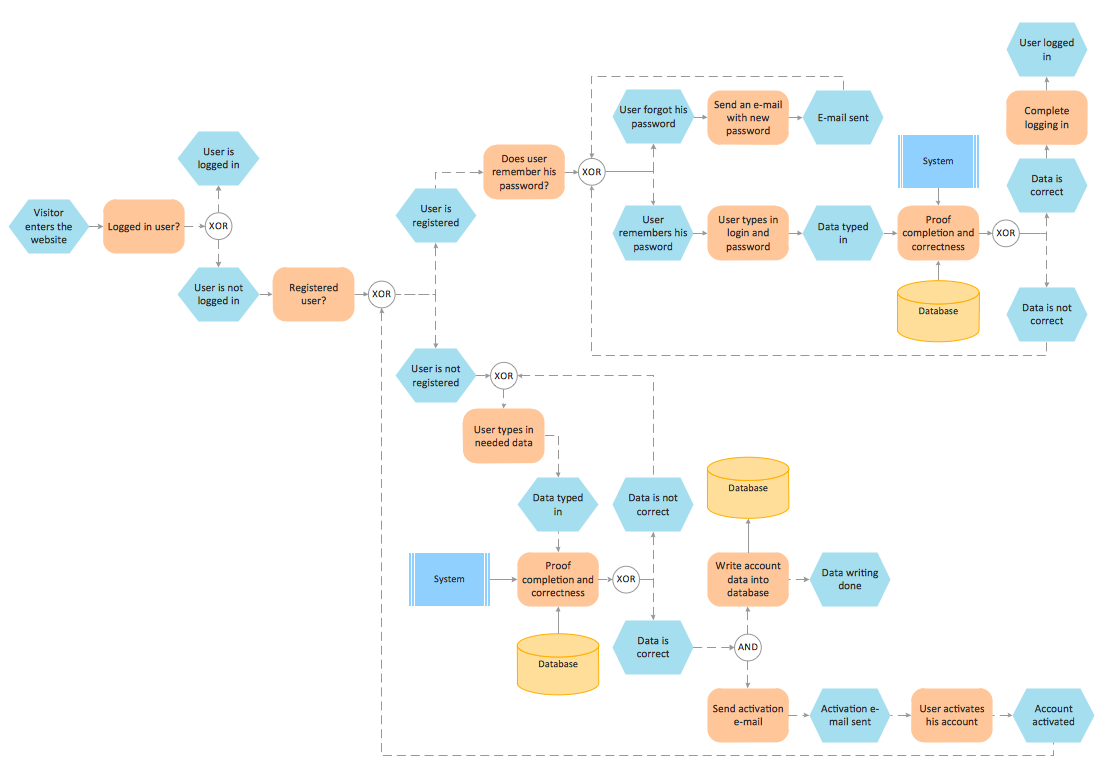
Event-driven Process Chain Diagrams

event-driven process chain diagram, EPC diagram, process chain flowchart
Event-Driven Process Chain Diagrams solution extends ConceptDraw DIAGRAM functionality with event driven process chain templates, samples of EPC engineering and modeling the business processes, and a vector shape library for drawing the EPC diagrams and EPC flowcharts of any complexity. It is one of EPC IT solutions that assist the marketing experts, business specialists, engineers, educators and researchers in resources planning and improving the business processes using the EPC flowchart or EPC diagram. Use the EPC solutions tools to construct the chain of events and functions, to illustrate the structure of a business process control flow, to describe people and tasks for execution the business processes, to identify the inefficient businesses processes and measures required to make them efficient.

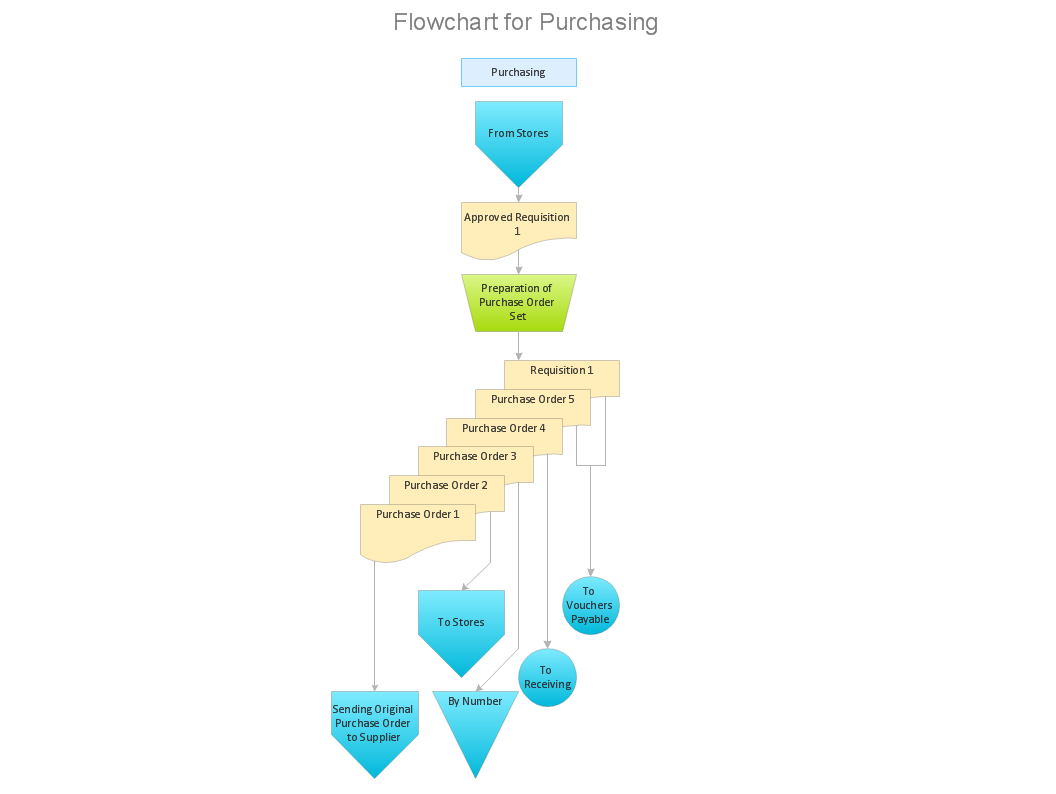
Introduction to bookkeeping: Accounting flowchart process

Everything about Bookkeeping: Accounting flowchart process. Which symbols to use, how to make a chart.