HelpDesk
How to Create an Enterprise Architecture Diagram in ConceptDraw PRO
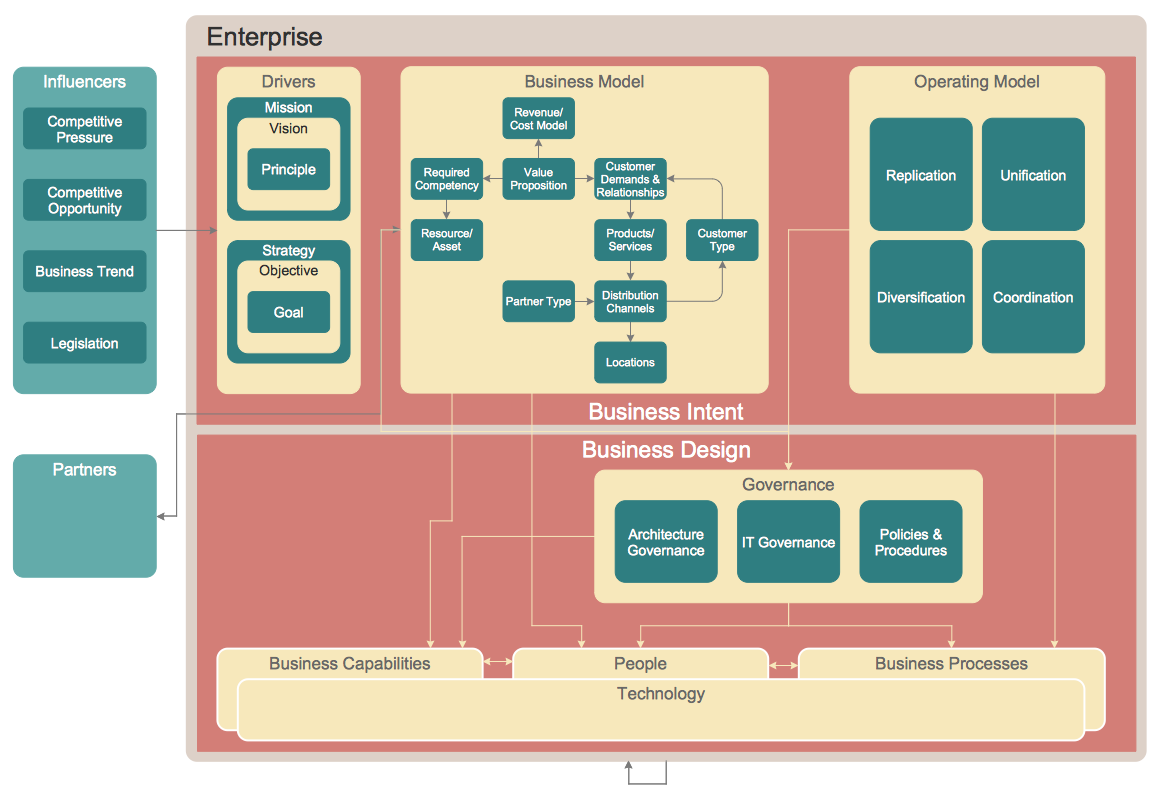
An Enterprise Architecture (EA) diagram is used to display the structure and operations of an organization.It is used to analyze and document an organization and its business functions, along with the applications and systems on which they are implemented. The aim of an enterprise architecture diagram is to determine how an organization can effectively achieve its current and future objectives. The Enterprise Architecture often uses diagrams to support the decision-making process. ConceptDraw PRO allows you to design Enterprise Architecture diagrams of any complexity.HelpDesk
How to Make a Logistics Flow Chart
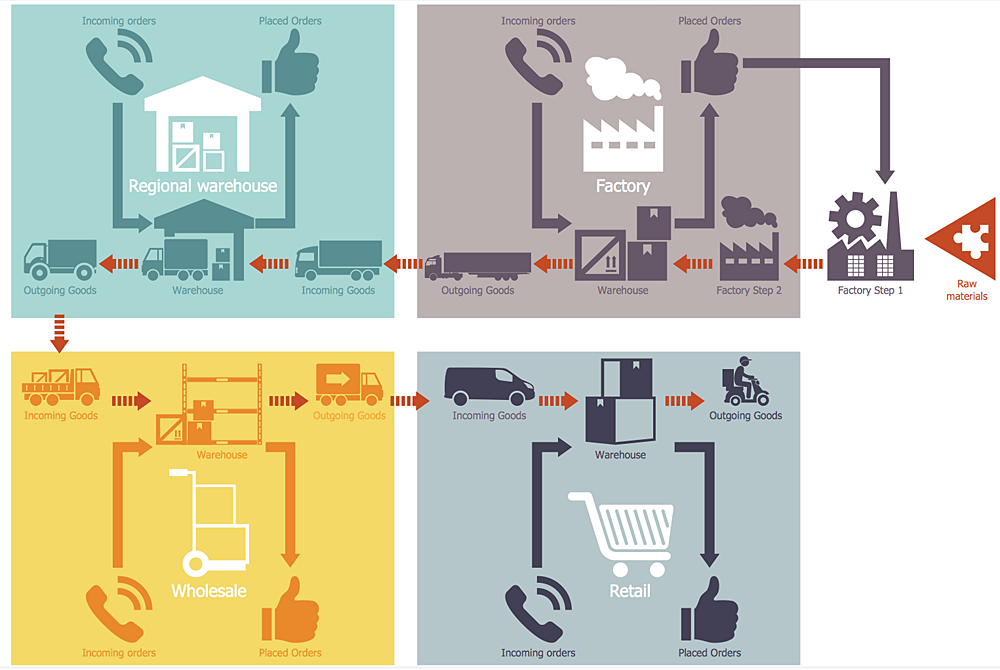
ConceptDraw Logistics Flow Charts solution is a tool for designing Logistics Flow Charts, Diagram and related infographics. You can create variety of logistics visualizations: Logistics flow chart, Inventory flow chart, Warehouse flowchart, Logistics process flow diagram, Warehouse management flow chart, Inventory control flowchart, or any other Logistics diagram for your business and effectively use them to promote the goods and services, and to enhance the economic stability of your business.
 Logistics Flow Charts
Logistics Flow Charts solution extends ConceptDraw PRO v11 functionality with opportunities of powerful logistics management software. It provides large collection of predesigned vector logistic symbols, pictograms, objects and clipart to help you design with pleasure Logistics flow chart, Logistics process flow diagram, Inventory flow chart, Warehouse flowchart, Warehouse management flow chart, Inventory control flowchart, or any other Logistics diagram. Use this solution for logistics planning, to reflect logistics activities and processes of an enterprise or firm, to depict the company's supply chains, to demonstrate the ways of enhancing the economic stability on the market, to realize logistics reforms and effective products' promotion.
 Enterprise Architecture Diagrams
Enterprise Architecture Diagrams solution extends ConceptDraw PRO software with templates, samples and library of vector stencils for drawing the diagrams of enterprise architecture models.
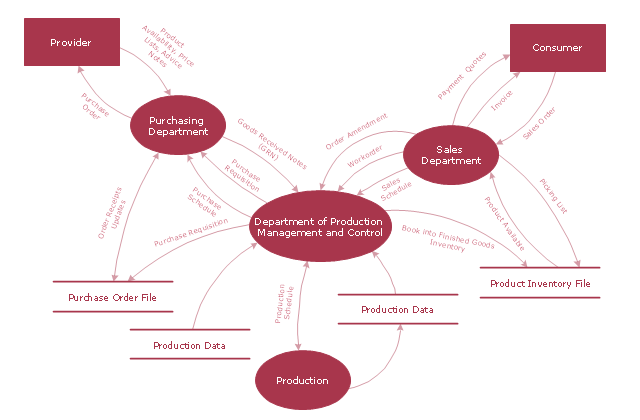
"A data flow diagram (DFD) is a graphical representation of the "flow" of data through an information system. It differs from the flowchart as it shows the data flow instead of the control flow of the program. A data flow diagram can also be used for the visualization of data processing (structured design). Data flow diagrams were invented by Larry Constantine, the original developer of structured design, based on Martin and Estrin's "data flow graph" model of computation.
It is common practice to draw a context-level Data flow diagram first which shows the interaction between the system and outside entities. The DFD is designed to show how a system is divided into smaller portions and to highlight the flow of data between those parts. This context-level Data flow diagram is then "exploded" to show more detail of the system being modeled" [Data model. Wikipedia]
The DFD (Yourdon and Coad notation) example "Model of small traditional production enterprise" was created using the ConceptDraw PRO diagramming and vector drawing software extended with the Data Flow Diagrams solution from the Software Development area of ConceptDraw Solution Park.
- Enterprise architecture domains | Enterprise architecture diagram ...
- Types of Flowcharts | How to Create an Enterprise Architecture ...
- How to Create an Enterprise Architecture Diagram in ConceptDraw ...
- Enterprise architecture diagram | Flowchart design . Flowchart ...
- Cloud Computing Architecture Diagrams | Definition Flowchart ...
- Process Flowchart | The ISE Enterprise Architecture Framework ...
- Enterprise Architecture Diagrams | Fishbone Diagram Problem ...
- How To Create a Flow Chart in ConceptDraw | Human Resource ...
- Enterprise Architecture Diagrams | How to Create an Enterprise ...
- Data Flow Diagram Architecture Example
- How to Create an Enterprise Architecture Diagram in ConceptDraw ...
- Basic Flowchart Symbols and Meaning | Types of Flowcharts | Cross ...
- Functional Flow Chart In Architectural Design
- Sample Project Flowchart . Flowchart Examples | How to Create an ...
- Sample Project Flowchart . Flowchart Examples | AWS Architecture ...
- Enterprise Data Architecture Diagram
- Data Flow Diagram Model | Example of DFD for Online Store (Data ...
- Cross-Functional Flowcharts | Types of Flowcharts | Basic Flowchart ...
- Business process Flow Chart - Event-Driven Process chain (EPC ...


