Database Flowchart Symbols

ER diagram tool for OS X

ERD Symbols and Meanings


Object-Oriented Design

Electrical Symbols — Lamps, Acoustics, Readouts

Network Diagram Software


Cisco Network Topology. Cisco icons, shapes, stencils and symbols

 Entity-Relationship Diagram (ERD)
An Entity-Relationship Diagram (ERD) is a visual presentation of entities and relationships. That type of diagrams is often used in the semi-structured or unstructured data in databases and information systems. At first glance ERD is similar to a flowch
Software for flowchart diagrams

Network Visualization with ConceptDraw DIAGRAM

Database Design

 Health Package
Health Package is a set of multifaceted solutions intended for visualization and illustration in a field of medicine and health, for drawing colorful, interesting and precise illustrations and infographics that will be used successfully in medical documents, articles, special magazines, posters, billboards, websites, presentations, collages. Having these solutions available, it will not be difficult to illustrate the medical editions, to convey the information in a full and interesting form, to teach students with use effective visual methods, to describe the medical facts, to tell about innovations in a field of medicine, health and correct nutrition, to explain the causes and consequences of different diseases, as well as the measures of their prevention and treatment.
 AWS Architecture Diagrams
AWS Architecture Diagrams with powerful drawing tools and numerous predesigned Amazon icons and AWS simple icons is the best for creation the AWS Architecture Diagrams, describing the use of Amazon Web Services or Amazon Cloud Services, their application for development and implementation the systems running on the AWS infrastructure. The multifarious samples give you the good understanding of AWS platform, its structure, services, resources and features, wide opportunities, advantages and benefits from their use; solution’s templates are essential and helpful when designing, description and implementing the AWS infrastructure-based systems. Use them in technical documentation, advertising and marketing materials, in specifications, presentation slides, whitepapers, datasheets, posters, etc.
Network Diagram Software Logical Network Diagram

Data Flow Diagram

Network Layout

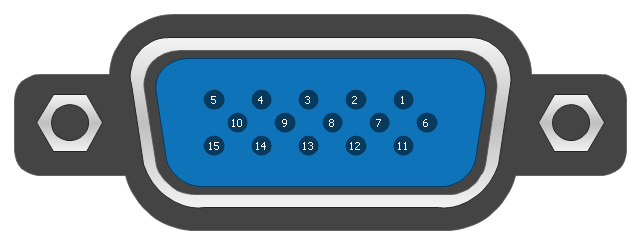
This pinout diagram example showing a VGA connector (as viewed from the socket) was redesigned from the Wikimedia Commons file: DE15 Connector Pinout.svg. [commons.wikimedia.org/ wiki/ File:DE15_ Connector_ Pinout.svg]
"A Video Graphics Array (VGA) connector is a three-row 15-pin DE-15 connector. The 15-pin VGA connector is found on many video cards, computer monitors, and high definition television sets. On laptop computers or other small devices, a mini-VGA port is sometimes used in place of the full-sized VGA connector.
DE-15 is also conventionally called RGB connector, D-sub 15, mini sub D15, mini D15, DB-15, HDB-15, HD-15 or HD15 (High Density, to distinguish it from the older and less flexible DE-9 connector used on some older VGA cards, which has the same shell size but only two rows of pins).
VGA connectors and cables carry analog component RGBHV (red, green, blue, horizontal sync, vertical sync) video signals, and VESA Display Data Channel (VESA DDC) data. In the original version of DE-15 pinout, one pin was keyed by plugging the female connector hole; this prevented non-VGA 15 pin cables from being plugged into a VGA socket. Four pins carried Monitor ID bits which were rarely used; VESA DDC redefined some of these pins and replaced the key pin with +5 V DC power supply.
The VGA interface is not engineered to be hotpluggable (so that the user can connect or disconnect the output device while the host is running), although in practice this can be done and usually does not cause damage to the hardware or other problems. However, nothing in the design ensures that the ground pins make a connection first and break last, so hotplugging may introduce surges in signal lines which may or may not be adequately protected against. Also, depending on the hardware and software, detecting a monitor being connected might not work properly in all cases." [VGA connector. Wikipedia]
The pinout diagram example "VGA connector pinout" was created using the ConceptDraw PRO diagramming and vector drawing software extended with the Audio and Video Connectors solution from the Engineering area of ConceptDraw Solution Park.
VGA connector pinout
 Health Sciences
Health Sciences solution including professionally designed samples and wide range of high-quality vector icons and pictograms of basic medical sciences, surgery specializations, internal medicine, medical diagnostics, interdisciplinary fields, mental health, obstetrics and gynecology, public health, allied health, and other medical specialties, is a perfect assistant in drawing Health diagrams, schematics, illustrations, infographics and slides for presentations on the healthcare, medical and health sciences thematic, in development knowledge in health science, in studying and representing the physical, mental and social aspects of human health, in determining the role of different health sciences at this process, finding and explaining new methods of treatment different diseases, making an overview and describing the main characteristics of health sciences in a visual form.
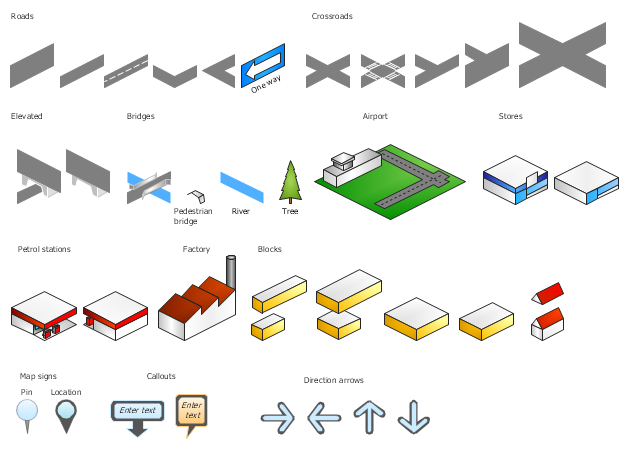
The vector stencils library "3D directional maps" contains 40 symbols for creating pictorial maps, street maps, locator maps, transit maps, tourist maps with points of interest (POI), road maps and route maps using the ConceptDraw PRO diagramming and vector drawing software.
"Pictorial maps are a category of maps that are also loosely called illustrated maps, panoramic maps, perspective maps, bird’s-eye view maps and Geopictorial maps amongst others. In contrast to the regular road map, Atlas or topographic cartography, pictorial maps depict a given territory with a more artistic rather than technical style. The cartography can be a sophisticated 3-D perspective landscape or a simple map graphic enlivened with illustrations of buildings, people and animals. They can feature all sorts of varied topics like historical events, legendary figures or local agricultural products and cover anything from an entire continent to a college campus. ...
Pictorial maps usually show an area as if viewed from above at an oblique angle. They are not generally drawn to scale in order to show street patterns, individual buildings, and major landscape features in perspective. While regular maps focus on the accurate rendition of distances, pictorial maps enhance landmarks and often incorporate a complex interplay of different scales into one image in order to give the viewer a more familiar sense of recognition." [Pictorial maps. Wikipedia]
The design elements library "3D directional maps" is included in the Directional Maps solution from the Maps area of ConceptDraw Solution Park.
3D pictorial map symbols
Network Glossary Definition

- Design elements - Qualifying | Design elements - Electrical and ...
- Electrical Db Design Video Dawunlod
- Design elements - Electrical and telecom | ConceptDraw Solution ...
- Electrical Symbols, Electrical Diagram Symbols | Design elements ...
- Design elements - Qualifying | How To use House Electrical Plan ...
- Electrical Symbols, Electrical Diagram Symbols | Design elements ...
- Three Phase Db Drawing Electrical
- Wiring Diagrams with ConceptDraw DIAGRAM | Cafe electrical floor ...
- India Latest Electrical House Wiring With Db Full Diagram Please
- Electrical Symbols, Electrical Diagram Symbols | How To use House ...
- Extension Board Drawing Electrical Engineering
- Electrical Symbols — Qualifying | Electrical Symbols, Electrical ...
- Design elements - Cable TV (CATV) | How To use House Electrical ...
- Diagram For Flow Chart Process Of Computer Aided Design
- Vayaring D B Fitting Plan
- Half Pipe Plans | Design elements - Appliances | Plumbing and ...
- Process Flowchart | Basic Flowchart Images. Flowchart Examples ...
- Electrical Symbol For Water Heater
- Software development with ConceptDraw DIAGRAM | Design ...