This site uses cookies. By continuing to browse the ConceptDraw site you are agreeing to our Use of Site Cookies.

Electrical Symbols, Electrical Diagram Symbols

How to create Electrical Diagram? It’s very easy! All you need is a powerful software. It wasn’t so easy to create Electrical Symbols and Electrical Diagram as it is now with electrical diagram symbols offered by the libraries of Electrical Engineering Solution from the Industrial Engineering Area at the ConceptDraw Solution Park.
This solution provides 26 libraries which contain 926 electrical symbols from electrical engineering: Analog and Digital Logic, Composite Assemblies, Delay Elements, Electrical Circuits, Electron Tubes, IGFET, Inductors, Integrated Circuit, Lamps, Acoustics, Readouts, Logic Gate Diagram, MOSFET, Maintenance, Power Sources, Qualifying, Resistors, Rotating Equipment, Semiconductor Diodes, Semiconductors, Stations, Switches and Relays, Terminals and Connectors, Thermo, Transformers and Windings, Transistors, Transmission Paths,VHF UHF SHF.

Entity Relationship Diagram Symbols

Creating an entity-relationship (ER) model is to visually represent the structure of a business database, where data equates to entities (or objects) that are linked by defined relationships expressing dependencies and requirements. By nature it is an abstract visualization, the first step in the design process towards creating a logical and functional database.
ERD symbols used for professional ERD drawing are collected in libraries from the Entity-Relationship Diagram (ERD) solution for ConceptDraw DIAGRAM.

ERD Symbols and Meanings

Crow's foot notation is used in Barker's Notation, Structured Systems Analysis and Design Method (SSADM) and information engineering. Crow's foot diagrams represent entities as boxes, and relationships as lines between the boxes. Different shapes at the ends of these lines represent the cardinality of the relationship.
The Chen's ERD notation is still used and is considered to present a more detailed way of representing entities and relationships.
To create an ERD, software engineers mainly turn to dedicated drawing software, which contain the full notation resources for their specific database design - ERD symbols and meanings. CS Odessa has released an all-inclusive Entity-Relationship Diagram (ERD) solution for their powerful drawing program, ConceptDraw DIAGRAM.
How to Build an Entity Relationship Diagram (ERD)

Basic Flowchart Symbols and Meaning

Flowchart Symbols and Meaning - Provides a visual representation of basic flowchart symbols and their proposed use in professional workflow diagram, standard process flow diagram and communicating the structure of a well-developed web site, as well as their correlation in developing on-line instructional projects. See flowchart's symbols by specifics of process flow diagram symbols and workflow diagram symbols.
How to Build a Flowchart

Local area network (LAN). Computer and Network Examples

A local area network (LAN) is a devices network that connect with each other in the scope of a home, school, laboratory, or office. Usually, a LAN comprise computers and peripheral devices linked to a local domain server. All network appliances can use a shared printers or disk storage. A local area network serve for many hundreds of users. Typically, LAN includes many wires and cables that demand a previously designed network diagram. They are used by IT professionals to visually document the LANs physical structure and arrangement.
ConceptDraw - Perfect Network Diagramming Software with examples of LAN Diagrams. ConceptDraw Network Diagram is ideal for network engineers and network designers who need to draw Local Area Network diagrams.
How to Draw a Computer Network
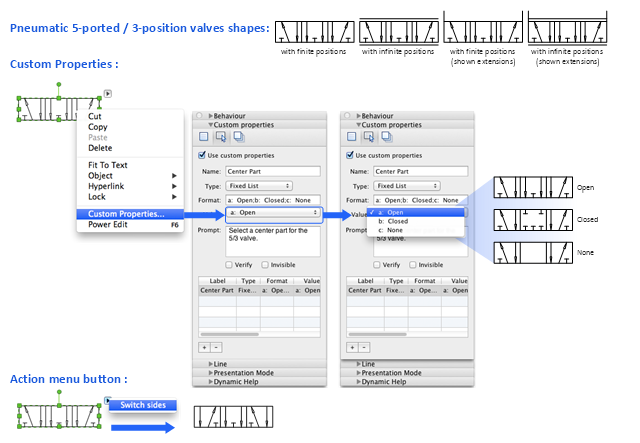
"Directional control valves are one of the most fundamental parts in hydraulic machinery as well and pneumatic machinery. They allow fluid flow into different paths from one or more sources. They usually consist of a spool inside a cylinder which is mechanically or electrically controlled. The movement of the spool restricts or permits the flow, thus it controls the fluid flow. ...
While working with layouts of hydraulic machinery it is cumbersome to draw actual picture of every valve and other components.instead of pictures symbols are used for variety of components in the hydraulic system to highlight the functional aspects. symbol for directional control valve is made of number of square boxes adjacent to each other depending on the number of positions.connections to the valve are shown on these squares by capital letters.usually they are named only in their normal position and not repeated in other positions.actuation system of the valve is also designated in its symbol." [Directional control valve. Wikipedia]
The Mac template "Pneumatic 5-ported 3-position valve" for the ConceptDraw PRO diagramming and vector drawing software is included in the Mechanical Engineering solution from the Engineering area of ConceptDraw Solution Park.
www.conceptdraw.com/ solution-park/ engineering-mechanical
Pneumatic directional control valve
Pneumatic directional control valve, five-port, three-position, valve,

Components of ER Diagram

ConceptDraw gives the ability to draw ER diagram (ERD) for visual describing database using the entity relationship symbols, work flow shapes, entity relationship stencils. Entity-Relationship model making possibility to describe a database using the components of ER Diagram in which in the tables data can be the point to data in other tables - for instance, your entry in the database could point to several entries.

What is Entity-Relationship Diagram

Entity Relationship Diagram (ERD) is an acknowledged method to visualize the logical structure of databases. Using special symbols described in ERD notations you can depict a database of any complexity.
The vector graphic ER diagrams produced when using ConceptDraw ERD solution can be used in whitepapers, presentations, datasheets, posters, or any technical materials.

Flowchart design. Flowchart symbols, shapes, stencils and icons

A flowchart is a type of diagram that represents an algorithm, workflow or process, showing the steps as boxes of various kinds - flowchart symbols, and their order by connecting them with arrows.
Mavericks have always desired to stand apart and gorgeous design is the recipe for that. Any business graphic document will be more understandable if will use an expository color scheme for their parts. Flowchart design makes versatile presenting and explaining of the process and gives a fresh view that distinguishes it from black and white flowcharts on a paper. Workflow diagram or process flow diagrams become more understandable to ordinary people when it use minimum symbols and special signs.
The best design can be accomplished by starting from any of the suitable Conceptdraw examples. Pick one of them and begin to input proper text into each Flowchart symbols and shapes. Apply less colors in the document and don't turn into rainbow your diagram, three or four will be enough, also note that business process flowchart may not contain bright color hues. The next clue is to use identical colors for same flowchart shape types.
Business Process Modeling with ConceptDraw
Business Process Modeling with ConceptDraw "Business Process Diagrams" Solution

Graphical User Interface Examples

ConceptDraw DIAGRAM extended with Windows 8 User Interface solution from the Software Development area is the best gui software. Using the drawing tools, libraries of vector objects, graphical user interface examples that offers Windows 8 User Interface solution, you will easily design the Windows 8 user interfaces and Windows 8 UI design patterns of any complexity.

Anyone Have an ERD Symbols Quick Reference?

ERD drawing becomes easier with predesigned entity relationship symbols, work flow shapes, entity relationship stencils. All variety of ERD symbols you may need for ERDs design is packed into libraries and templates from Entity-Relationship Diagram (ERD) Solution for ConceptDraw DIAGRAM diagramming and vector drawing software.
But anyone have an ERD symbols quick reference? Detailed reference information for them is represented at the tables.

Flowchart Maker

A flowchart maker is a software showing the interaction, sequence or organization. It also known as flowchart maker or ConceptDraw DIAGRAM standard supplied with different types of symbol collections: standard symbols, branded set and authored. It used strictly for enhancing scientific or business documents with abstract explanatory pictures.

Business graphic applications show a special knowledge representations and include many features for creating schematic pictures. These graphic tools are known as flowchart maker or flowchart maker software.

Network Diagram Software. LAN Network Diagrams. Physical Office Network Diagrams

ConceptDraw Network Diagramming Software with examples of WAN, LAN Diagrams. ConceptDraw Network Diagram is ideal for network engineers and network designers who need to draw Local Area Network diagrams, physical office network diagrams and Diagram for LAN.
How to Draw a Computer Network

Process Flowchart

ConceptDraw is Professional business process mapping software for making process flow diagram, workflow diagram, general flowcharts and technical illustrations for business documents. It is includes rich examples, templates, process flowchart symbols. ConceptDraw flowchart maker allows you to easier create a process flowchart. Use a variety of drawing tools, smart connectors, flowchart symbols and shape libraries to create flowcharts of complex processes, process flow diagrams, procedures and information exchange.
How To Create a Process Flow Chart (business process modelling techniques)

Metropolitan area networks (MAN). Computer and Network Examples

Metropolitan Area Network combines local networks located within a city, and is based on high data rate compounds, implemented on the basis of fiber channels and other digital data transmission channels. Now, with the increasing number of network communities, wireless local area networks based on 802.11b standard are combined into a wireless metropolitan area network consisting of affordable antenna systems and consumer-grade wireless equipment using 802.11a and 802.11b standards.

Mechanical Drawing Software

It is impossible to imagine mechanical engineering without drawings which represent various mechanical schemes and designs. ConceptDraw DIAGRAM diagramming and vector drawing software supplied with Mechanical Engineering solution from the Engineering area of ConceptDraw Solution Park offers the set of useful tools which make it a powerful Mechanical Drawing Software.

Blueprint Software

The blueprints are the set of drawings used by architects and builders in the process of construction of the buildings. The blueprints represent the top views on the buildings (homes, offices, etc.). They are drawn in the scale and use the special blueprint symbols and blueprints codes. Earlier the blueprints wer printed on the special paper and was blue.
It's very easy, quick and convenient to draw the professional looking blueprints in ConceptDraw DIAGRAM diagramming and vector drawing software.

Graphical Symbols to use in EPC diagrams

Event-Driven Process Chain Diagrams for improvement throughout an organisation.
ConceptDraw DIAGRAM - software that reduces the time needed to create a business process model.

Hotel Plan. Hotel Plan Examples

In case you need to make a plan for your own future hotel or to do it for someone else, then you can always find the way to make such template very quickly and to have a very good looking result in the end. Whichever type of the hotels you want to illustrate in a way of a floor plan, you can always do it with ConceptDraw DIAGRAM drawing application.

Data Flow Diagram Symbols. DFD Library

Data Flow Diagrams show information transfers and process steps of a system. The general concept is an approach of a depicting how occurs input in a system, further processes and what runs out. The aim of DFD is in accomplishing of understanding between developers and users. Data flow diagrams are maintained with other methods of structured systems analysis.