How to Draw an Organization Chart

Audit Flowchart Symbols

Stakeholder Onion Diagrams

Business Process Modeling with ConceptDraw

SWOT Analysis

Influence Diagram

Competitor Analysis

Marketing Flow Chart

ConceptDraw Arrows10 Technology

Market Chart

Process Mapping

Stakeholder Onion Diagram Template

Pyramid Diagram

The vector stencils library "Audit flowcharts" contains 31 symbols of audit flow chart diagrams for accounting, financial management, fiscal information tracking, money management, decision flowcharts, and financial inventories.
"A financial audit, or more accurately, an audit of financial statements, is the verification of the financial statements of a legal entity, with a view to express an audit opinion. The audit opinion is intended to provide reasonable assurance, but not absolute assurance, that the financial statements are presented fairly, in all material respects, and/ or give a true and fair view in accordance with the financial reporting framework. The purpose of an audit is to provide an objective independent examination of the financial statements, which increases the value and credibility of the financial statements produced by management, thus increase user confidence in the financial statement, reduce investor risk and consequently reduce the cost of capital of the preparer of the financial statements. ...
Financial audits are typically performed by firms of practicing accountants who are experts in financial reporting. The financial audit is one of many assurance functions provided by accounting firms. Many organizations separately employ or hire internal auditors, who do not attest to financial reports but focus mainly on the internal controls of the organization. External auditors may choose to place limited reliance on the work of internal auditors. Auditing promotes transparency and accuracy in the financial disclosures made by an organization, therefore would likely to reduce of such corporations to conceal unscrupulous dealings.
Internationally, the International Standards on Auditing (ISA) issued by the International Auditing and Assurance Standards Board (IAASB) is considered as the benchmark for audit process. Almost all jurisdictions require auditors to follow the ISA or a local variation of the ISA." [Financial audit. Wikipedia]
The example "Design elements - Audit flowchart" was created using the ConceptDraw PRO diagramming and vector drawing software extended with the Audit Flowcharts solution from the Finance and Accounting area of ConceptDraw Solution Park.
Audit flowchart symbols

Business Productivity - Management

This SWOT matrix diagram example was created on the base of article "An Easy Way To Jumpstart Your Strategic Plan: SWOT" by Leslie Wolf from the website of the California Digital Library, the University of California. "Strategic planning doesn’t have to be a daunting and lengthy process. The goal is really a simple one: to help you understand your world and build a road map to guide your efforts. ...
This analysis tool can help you focus your attention on the specific success factors that are right for your team.
The tool is called a SWOT analysis. SWOT stands for Strengths and Weaknesses, Opportunities and Threats. Here’s what it means:
(1) Strengths are those positive internal attributes that strengthen your business or team. You can develop plans to capitalize on those strengths.
(2) Weaknesses are those negative internal attributes that are working against your success. You can shore up those weaknesses so they don’t stop your success.
(3) Opportunities are those external conditions that can have a positive effect on your goals. These opportunities can point you in the right direction.
(4) Threats are those external conditions that can have a negative effect on your goals. These threats will affect you less if you can identify and minimize them. ...
We thought it would be helpful to show you a sample SWOT analysis for a business you can easily visualize: a small independent bookstore in a university town. The store owner brought the team together to think about how the bookstore could survive during the continuing financial downturn. After an hour of brainstorming, this is the SWOT analysis they developed." [cdlib.org/ cdlinfo/ 2010/ 09/ 29/ an-easy-way-to-jumpstart-your-strategic-plan-swot/ ]
The matrix diagram example "SWOT analysis for a small independent bookstore" was created using the ConceptDraw PRO diagramming and vector drawing software extended with the SWOT Analysis solution from the Management area of ConceptDraw Solution Park.
SWOT matrix

"Porter five forces analysis is a framework for industry analysis and business strategy development. It draws upon industrial organization (IO) economics to derive five forces that determine the competitive intensity and therefore attractiveness of a market. Attractiveness in this context refers to the overall industry profitability. An "unattractive" industry is one in which the combination of these five forces acts to drive down overall profitability. A very unattractive industry would be one approaching "pure competition", in which available profits for all firms are driven to normal profit.
Three of Porter's five forces refer to competition from external sources. The remainder are internal threats.
Porter referred to these forces as the micro environment, to contrast it with the more general term macro environment. They consist of those forces close to a company that affect its ability to serve its customers and make a profit. A change in any of the forces normally requires a business unit to re-assess the marketplace given the overall change in industry information. The overall industry attractiveness does not imply that every firm in the industry will return the same profitability. Firms are able to apply their core competencies, business model or network to achieve a profit above the industry average. A clear example of this is the airline industry. As an industry, profitability is low and yet individual companies, by applying unique business models, have been able to make a return in excess of the industry average.
Porter's five forces include - three forces from 'horizontal' competition: the threat of substitute products or services, the threat of established rivals, and the threat of new entrants; and two forces from 'vertical' competition: the bargaining power of suppliers and the bargaining power of customers.
This five forces analysis, is just one part of the complete Porter strategic models. The other elements are the value chain and the generic strategies." [Porter five forces analysis. Wikipedia]
The block diagram example "Porter's five forces model" was created using the ConceptDraw PRO diagramming and vector drawing software extended with the Block Diagrams solution from the area "What is a Diagram" of ConceptDraw Solution Park.
Block diagram

The vector stencils library "Business people pictograms" contains 14 icons of business people.
Use it to draw your pictorial infographics.
The example "Business people pictograms - Vector stencils library" was created using the ConceptDraw PRO diagramming and vector drawing software extended with the Pictorial infographics solution from the area "What is infographics" in ConceptDraw Solution Park.
Businessman

Businesswoman

Businessman, full grown

Businesswoman, full grown

Business group

Work team

Presentation

Waiting

Working time

Discussion

Business idea

Agreement

Career

Business growth

BPMN

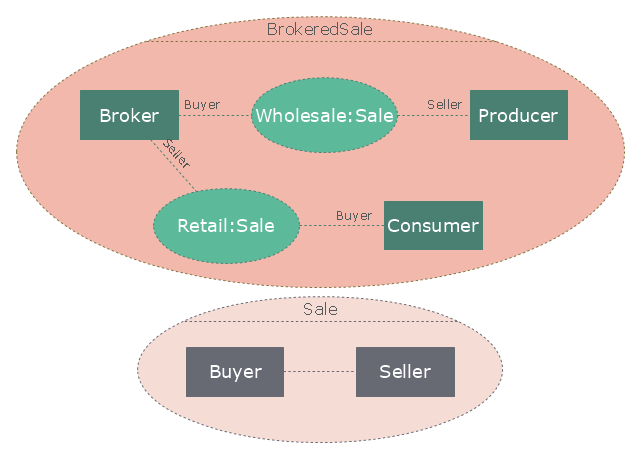
"A broker is an individual or party (brokerage firm) that arranges transactions between a buyer and a seller for a commission when the deal is executed. A broker who also acts as a seller or as a buyer becomes a principal party to the deal. Distinguish agent - one who acts on behalf of a principal. ...
In general a broker is an independent agent used extensively in some industries. A broker's prime responsibility is to bring sellers and buyers together and thus a broker is the third-person facilitator between a buyer and a seller. An example would be a real estate broker who facilitates the sale of a property.
Brokers also can furnish market information regarding prices, products, and market conditions. Brokers may represent either the seller (90% of the time) or the buyer (10%) but not both at the same time. An example would be a stockbroker, who makes the sale or purchase of securities on behalf of his client. Brokers play a huge role in the sale of stocks, bonds, and other financial services." [Broker. Wikipedia]
The UML composite structure diagram example "Sale process" was created using the ConceptDraw PRO diagramming and vector drawing software extended with the Rapid UML solution from the Software Development area of ConceptDraw Solution Park.
UML composite structure diagram
- Organizational Structure | How to Draw an Organization Chart ...
- How to Draw an Organization Chart | Organizational Charts ...
- Example of Organizational Chart | Basic Flowchart Symbols and ...
- Organization Chart Templates | Draw Company Structure with ...
- 25 Typical Orgcharts | Business Board Org Chart | Examples of ...
- How to Draw an Organization Chart | Matrix Organization Structure ...
- Diagrame Of An Organisation Chart Of A Well Established Business
- Drawing Of Organization Structure Of Medium Size Construction
- How to Draw an Organizational Chart Using ConceptDraw PRO ...
- How to Draw an Organization Chart | Technical Flow Chart | Pie ...
- Organizational Chart Of A Food Distribution Company
- Draw And Organization Structure On A Large Construction Firm
- 25 Typical Orgcharts | How to Draw an Organizational Chart Using ...
- How to Draw an Organization Chart | Create Organizational Chart ...
- Cubetto Flowchart | Construction Company Organization Chart
- How to Draw an Organization Chart | Matrix Organization Structure ...
- How to Draw an Organization Chart | Organizational Structure | Org ...
- 25 Typical Orgcharts | Organogram For Security Company
- Property Management Examples | Work Order Process Flowchart ...