Property Management Examples
This sample was created in ConceptDraw PRO diagramming and vector drawing software using the Seven Management and Planning Tools Solution from the Business Productivity area of ConceptDraw Solution Park. This sample shows the Property Management matrix, the ideas are ordered in regards to importance and frequency. This matrix gives the ability to turn the theory into quantifiable data.Work Order Process Flowchart. Business Process Mapping Examples
The business process is a set of actions or tasks which are undertaken by an organization for production some goods or services, they are then offered for the customers and are ordered by them. Process Flowcharts and Order Process Flowcharts are sufficiently prevalent, well known and actively used in variety of fields of life, business and science. They are constructed using the common standardized symbols, thus are clear and understandable for all. They help effectively represent the processes, determine the order in which the process activities happen, document the order processes, and also effectively analyze the processes with a goal to increase their efficiency. Create your own Process Flowcharts, Order Process Flowcharts, Cross-Functional Flow Charts representing the order processing steps using powerful drawing tools of ConceptDraw PRO software and variety of predesigned vector objects from the libraries of Business Process Mapping Solution from Business Processes area of ConceptDraw Solution Park.Create Response Charts
Visual navigation through the stages of a response process helps you locate specific actions to be taken via Action Mind Maps. Use ConceptDraw PRO and ConceptDraw MINDMAP for organize the process of response for interactions occurring in social media.UML Use Case Diagram Example - Estate Agency
UML Diagram Estate Agency. This sample was created in ConceptDraw PRO diagramming and vector drawing software using the UML Use Case Diagram library of the Rapid UML Solution from the Software Development area of ConceptDraw Solution Park. This sample shows the work of the estate agency and is used by the estate agencies, building companies, at the trainings of the estate agencies, for understanding the working processes of the estate agencies.Business Diagram Software
When managing the projects, people, or networks, there are daily designed and used different types of Business diagrams, so the powerful drawing software will be very useful for this. ConceptDraw PRO with large quantity of business solutions will meet your needs and will help you convey your ideas successful and rapidly, no matter are you professional or beginner. It is the best choice for business specialists and technical professionals who need quickly and easily explore, visualize, and communicate information. ConceptDraw PRO business diagram software is the most powerful business software and relational charting software. Create advanced, completely customizable Business Process Diagrams, Business Flow Charts, Work Flow Diagrams, Organizational Charts, Audit diagrams, Marketing diagrams, Value Stream Maps, TQM diagrams, ERD diagrams, EPC diagrams, Cause and Effect diagrams, Infographics, Dashboards, and other Relational business diagrams from your data using the powerful drawing tools of ConceptDraw Solution Park.
Basic Flowchart Symbols and Meaning
Flowcharts are the best for visually representation the business processes and the flow of a custom-order process through various departments within an organization. ConceptDraw PRO diagramming and vector drawing software extended with Flowcharts solution offers the full set of predesigned basic flowchart symbols which are gathered at two libraries: Flowchart and Flowcharts Rapid Draw. Among them are: process, terminator, decision, data, document, display, manual loop, and many other specific symbols. The meaning for each symbol offered by ConceptDraw gives the presentation about their proposed use in professional Flowcharts for business and technical processes, software algorithms, well-developed structures of web sites, Workflow diagrams, Process flow diagram and correlation in developing on-line instructional projects or business process system. Use of ready flow chart symbols in diagrams is incredibly useful - you need simply drag desired from the libraries to your document and arrange them in required order. There are a few serious alternatives to Visio for Mac, one of them is ConceptDraw PRO. It is one of the main contender with the most similar features and capabilities.
How to Use the ″Online Store PR Campaign″ Sample
Interactive tool helps you find the appropriate response to social media mentions quickly.How To Make a Bubble Chart
Bubble diagrams solution extends ConceptDraw PRO software with templates, Using ConceptDraw Connectors, you can make a bubble chart in moments. Using ConceptDraw you will be able to make a bubble chart from the ready ConceptDraw library objects or make your own objects. The created diagram can represent ideas organization, in brainstorming processes, by teachers for explaining difficult ideas or for presentations.Line Chart Examples
The Line Graphs solution from Graphs and Charts area of ConceptDraw Solution Park contains a set of examples, templates and design elements library of line and scatter charts. Use it to draw line and scatter graphs using ConceptDraw PRO diagramming and vector drawing software for illustrating your documents, presentations and websites.Financial Trade UML Use Case Diagram Example
This sample represents the actors, use cases and dependencies between them, and also the relationships between use cases. There are used dependency and use case generalization associations on this UML diagram. Use case generalization is used when you have two similar use cases, but one of them does more than another. This sample shows the work of the Financial Trade sphere and can be used by trading companies, commercial organizations, traders, different exchanges.What is Interactive Flowcharts
Organizing and Selecting Social Media Response Messages. Interactive Flowcharts can change the way one creates and organizes their social media response process.What is a Cross Functional Flow Chart?
For those who want to know what is a cross functional flowchart and how to draw it, we preared a special library and professional looking templates. Take all the advantage of your drawing software to learn and create such a well-designed flowcharts. Watch the HowTo video to learn more.UML Sample Project
Unified Modeling Language (UML) is a graphical modeling language for describing, visualizing, projecting and documenting of object oriented systems. UML digram is used for modeling of organizations and their business processes, for development the big projects, the complex software applications. Comprehensive UML diagram allows to create the set of interrelated documents that gives the complete visual representation of the modeling system.Organizing and Selecting Social Media Response Action
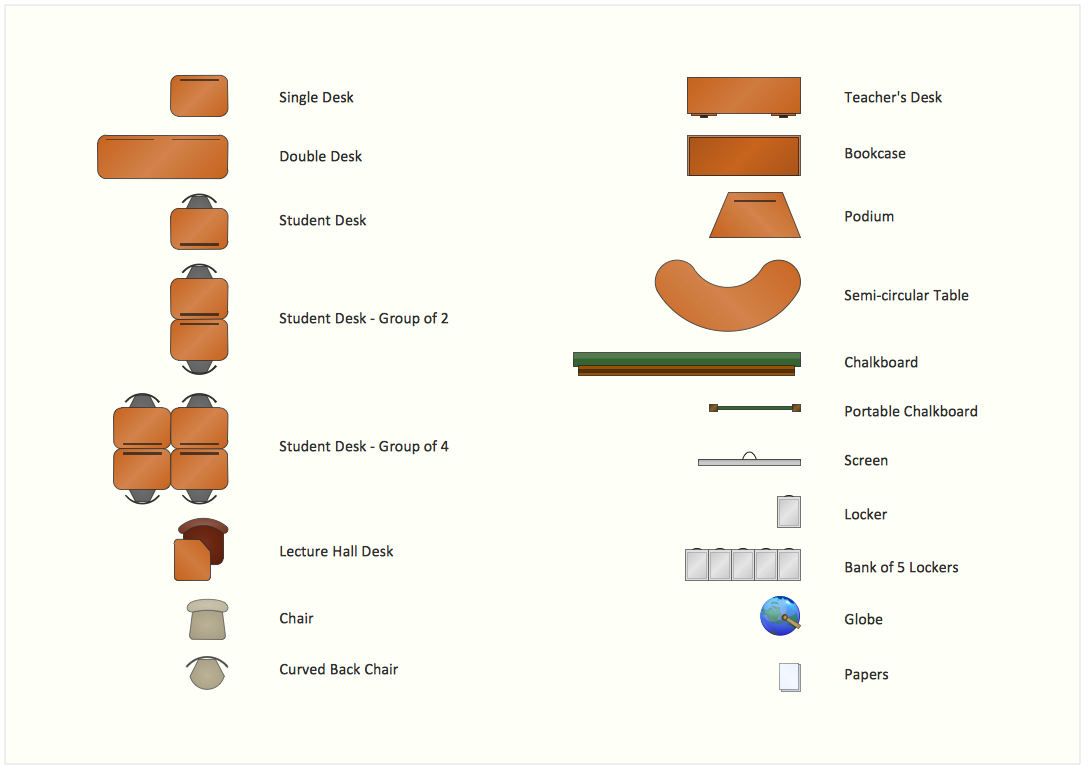
Interactive tool helps you find the appropriate response to social media mentions quickly.Interior Design School Layout - Design Elements
The correct and thorough planning of design, lighting and furniture arrangement is especially important for the school and training premises. The observance of established technical standards and recommendations when planning, construction or repair the classrooms and training offices is essential for the saving the health of pupils and students. ConceptDraw PRO diagramming and vector drawing software provides you with powerful drawing tools allowing to concentrate your attention on the comfort of pupils, on the recommendations, on the defined norms and other important details, not caring about how to display your planning ideas on the screen and eventually on the paper. The School and Training Plans solution from the Building Plans area of ConceptDraw Solution Park provides a lot of useful examples, samples, templates and vector design elements of school furniture and equipment. All they make ConceptDraw PRO a powerful interior design software, the best suited for development the plans of equipment layout at school or training office.- Diagrams Mean Nothing | Sample Organogram Real Estate Company
- Organizational Chart Of Real Estate Company
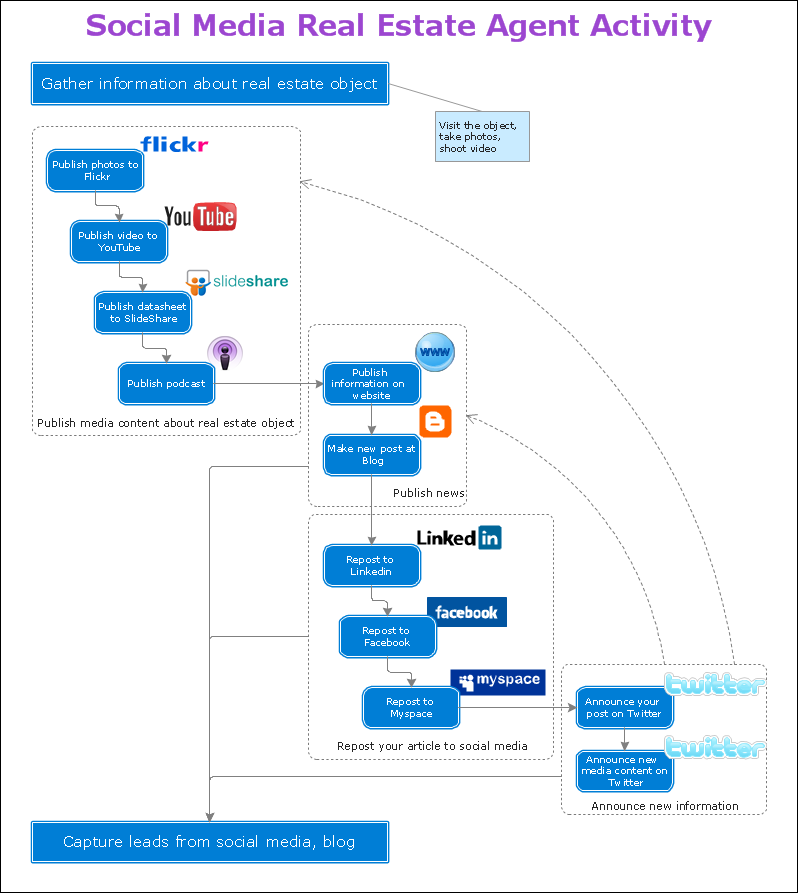
- Real Estate Marketing
- Business Diagram Software | Pyramid Chart Examples ...
- Business Diagram Software | Organogram Of An Estate Agent
- Organizational Structure Of Real Estate Company
- Business Diagram Software | Property Management Examples ...
- UML Use Case Diagram Example - Estate Agency | Financial Trade ...
- ConceptDraw PRO - Organizational chart software | 25 Typical ...
- Draw An Organisational Structure Of An Estate
- Simple Organizational Chart Of A Realty Developer
- Work Order Process Flowchart. Business Process Mapping Examples
- UML Use Case Diagram Example - Estate Agency | ConceptDraw ...
- Chart Of An Estate Firm
- Real Estate Marketing Design Templates Free Download
- Flow Chart Digram Of Real Estate
- Business Diagram Software | Property Management Examples ...
- List All Organisational Chart Of An Estate Firm
- Flow chart Example . Warehouse Flowchart | Organizational ...


