This site uses cookies. By continuing to browse the ConceptDraw site you are agreeing to our Use of Site Cookies.

Online Diagram Tool

ConceptDraw DIAGRAM diagramming and vector drawing software extended with Rapid UML Solution from the Software Development Area is a powerful online diagram tool that will help you design any types of UML diagrams simply and fast.

UML Component Diagram Example - Online Shopping

UML Component Diagram Online Shopping. This sample was created in ConceptDraw DIAGRAM diagramming and vector drawing software using the UML Component Diagram library of the Rapid UML Solution from the Software Development area of ConceptDraw Solution Park.
This sample shows the concept of the online shopping and is used for the understanding of the online shopping processes, of the online shops working processes, for projection and creating of the online stores.

Simple Diagramming

Create flowcharts, org charts, floor plans, business diagrams and more with ConceptDraw DIAGRAM.

UML Composite Structure Diagram

UML Composite Structure Diagram shows the internal structure of a class and the possible interactions at this structure.

State Diagram Example — Online Store

This sample was created in ConceptDraw DIAGRAM diagramming and vector drawing software using the UML State Mashine Diagram library of the Rapid UML Solution from the Software Development area of ConceptDraw Solution Park.
This sample shows the work of the online store and can be used for the understanding of the online shopping processes, for projection and creating of the online store.

UML Collaboration Diagram (UML2.0)

UML Collaboration Diagram depicts the interactions between objects or parts in terms of sequenced messages and describes both the static structure and dynamic behavior of a system.
Rapid UML solution provides templates, examples and libraries of stencils for quick and easy drawing all the types of system and software engineering diagrams according to UML 2.4 and 1.2 notations.

Example of DFD for Online Store (Data Flow Diagram)

Data flow diagrams (DFDs) reveal relationships among and between the various components in a program or system. DFDs are an important technique for modeling a system’s high-level detail by showing how input data is transformed to output results through a sequence of functional transformations.
Example of DFD for Online Store shows the Data Flow Diagram for online store and interactions between the Visitors, Customers and Sellers, as well as Website Information and User databases.
Steps to Creating a Sales Process Flow Chart

Cross-Functional Flowcharts in ConceptDraw

Use ConceptDraw DIAGRAM enhanced with solutions from ConceptDraw Solution Park to create diagrams to present and explain structures, process flows, logical relationships and networks.

How to create your UML Diagram

The UML diagrams in this Solution are divided into three broad categories: Structure Diagrams; Behavior Diagrams; Interaction Diagrams.
The 13 diagrams contained in the Rapid UML Solution offer an essential framework for systems analysts and software architects to create the diagrams they need to model processes from the conceptual level on through to project completion.

UML Class Diagram Example - Apartment Plan

UML Apartment Plan. This sample was created in ConceptDraw DIAGRAM diagramming and vector drawing software using the UML Class Diagram library of the Rapid UML Solution from the Software Development area of ConceptDraw Solution Park.
This sample show the detailed plan of the apartment and is used by building companies, design apartments, real estate agencies, at the buying / selling of the realty.

Network Topology

ConceptDraw has 10+ templates and 100+ examples for drawing the Network Topology:

10Base-T Star Network Topology
Bus Topology Diagram
Common Network Topologies
Fully Connected Network Topologies
Ring Network Topologies
Mesh Network Topologies


With more than 2 000 pre-designed network elements you can design own Network Topology of the simple LAN, WAN, etc.

UML Class Diagram Example - Medical Shop

State Diagram UML of Online Store. This sample was created in ConceptDraw DIAGRAM diagramming and vector drawing software using the UML Class Diagram library of the Rapid UML Solution from the Software Development area of ConceptDraw Solution Park.
This sample shows the work of the medical shop and is used at the creation of the medical shop or pharmacy project, for understanding the process of shopping in the medical shop, for keeping purchases, for medical supplies.
"Online shopping or e-shopping is a form of electronic commerce which allows consumers to directly buy goods or services from a seller over the Internet using a web browser. Alternative names are: e-web-store, e-shop, e-store, Internet shop, web-shop, web-store, online store, online storefront and virtual store. Mobile commerce (or m-commerce) describes purchasing from an online retailer's mobile optimized online site or app.
An online shop evokes the physical analogy of buying products or services at a bricks-and-mortar retailer or shopping center; the process is called business-to-consumer (B2C) online shopping. In the case where a business buys from another business, the process is called business-to-business (B2B) online shopping. The largest of these online retailing corporations are Alibaba, Amazon.com, and eBay. Retail success is no longer all about physical stores. This is evident because of the increase in retailers now offering online store interfaces for consumers. With the growth of online shopping, comes a wealth of new market footprint coverage opportunities for stores that can appropriately cater to offshore market demands and service requirements." [Online shopping. Wikipedia]
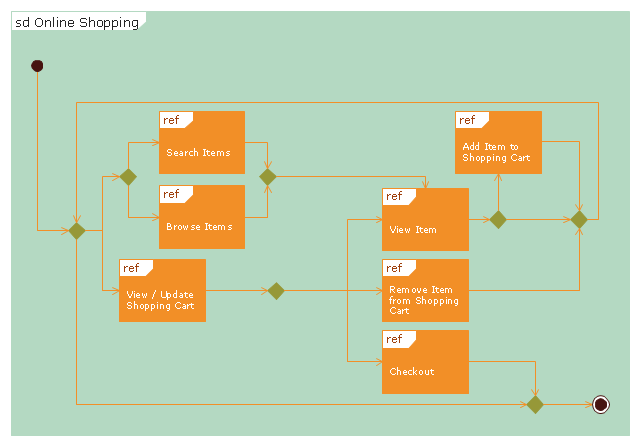
The UML interaction overview diagram example "Online shopping" was created using the ConceptDraw PRO diagramming and vector drawing software extended with the Rapid UML solution from the Software Development area of ConceptDraw Solution Park.
UML interaction overview diagram
UML interaction overview diagram, interaction, initial, final, decision, merge,

UML Component Diagram

UML Component Diagrams are used to illustrate the structure of arbitrarily complex systems and illustrates the service consumer - service provider relationship between components.

UML Class Diagram Example - Social Networking Site

UML Diagrams Social Networking Sites Project. This sample was created in ConceptDraw DIAGRAM diagramming and vector drawing software using the UML Class Diagram library of the Rapid UML Solution from the Software Development area of ConceptDraw Solution Park.
This sample shows the structure of the popular social networking site Linkedin and is used in the business field, in IT, at the projection and creating of the social networking sites.

Stakeholder Management System

Stakeholder management is a critical component to the successful delivery of any project, programme or activity.
ConceptDraw DIAGRAM is a powerful diagramming and vector drawing software. Now, thanks to the Stakeholder Onion Diagrams Solution included to the Management Area of ConceptDraw Solution Park, ConceptDraw DIAGRAM became also unique stakeholder management system design software.

Work Process

Any work process visualized as a workflow diagram becomes easier-to-analyse. To visualize work processes regularly we recommend to use ConceptDraw DIAGRAM software extended with the Workflow Diagrams solution. This software contains features and technologies designed to draw workflow diagrams faster.

UML Tool & UML Diagram Examples

The classical design of any automated process is UML diagrams that provide wide graphical ways to present all aspects of automation.
Solution RapidUML from Software Development area of ConceptDraw Solution Park provides templates, examples and 13 vector stencils libraries for drawing all types of UML 1.x and 2.x diagrams using ConceptDraw DIAGRAM diagramming and vector drawing software.
Use these UML diagram templates and examples to quickly start drawing your own UML diagrams.

Entity Relationship Diagram Symbols

Creating an entity-relationship (ER) model is to visually represent the structure of a business database, where data equates to entities (or objects) that are linked by defined relationships expressing dependencies and requirements. By nature it is an abstract visualization, the first step in the design process towards creating a logical and functional database.
ERD symbols used for professional ERD drawing are collected in libraries from the Entity-Relationship Diagram (ERD) solution for ConceptDraw DIAGRAM.

Hotel Service Process

This sample shows computer network diagram of the hotel service process, structure of the hotel service departments and the connection of each department to the internet using the WLAN equipment (routers, hub. etc.).
This sample was created in ConceptDraw DIAGRAM diagramming and vector drawing software using the Computer and Networks solution from Computer and Networks area of ConceptDraw Solution Park.