Donut Chart Templates

Pie Chart Examples and Templates

Pie Chart

Social Media Flowchart Symbols

Line Graph

Pyramid Chart Examples

Scatter Chart Examples

Pyramid Diagram

Line Chart Examples

Bar Diagrams for Problem Solving. Create economics and financial bar charts with Bar Graphs Solution

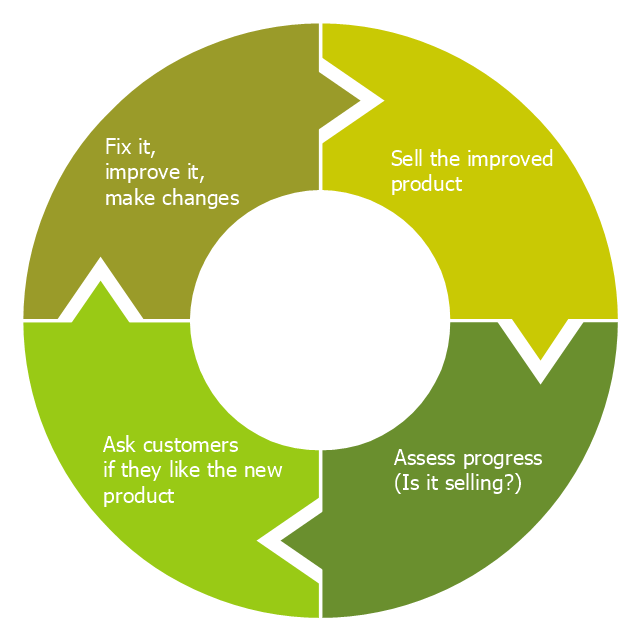
"Feedback is a process in which information about the past or the present influences the same phenomenon in the present or future. As part of a chain of cause-and-effect that forms a circuit or loop, the event is said to "feed back" into itself. ...
Feedback loop - the complete causal path that leads from the initial detection of the gap to the subsequent modification of the gap. ...
Feedback is commonly divided into two types - usually termed positive and negative. The terms can be applied in two contexts:
(1) the altering of the gap between reference and actual values of a parameter, based on whether the gap is widening (positive) or narrowing (negative),
(2) the valence of the action or effect that alters the gap, based on whether it has a happy (positive) or unhappy (negative) emotional connotation to the recipient or observer." [Feedback. Wikipedia]
This cycle diagram example was redesigned from the Wikimedia Commons file: Business Feedback Loop.jpg. [commons.wikimedia.org/ wiki/ File:Business_ Feedback_ Loop.jpg]
This file is made available under the Creative Commons CC0 1.0 Universal Public Domain Dedication. [creativecommons.org/ publicdomain/ zero/ 1.0/ deed.en]
The ring chart example "Business feedback loop" was created using the ConceptDraw PRO diagramming and vector drawing software extended with the Target and Circular Diagrams solution from the Marketing area of ConceptDraw Solution Park.
www.conceptdraw.com/ solution-park/ marketing-target-and-circular-diagrams
Ring chart
Pyramid Diagram

Organizational Chart Templates


Bar Diagrams for Problem Solving. Create business management bar charts with Bar Graphs Solution

Bar Graph

- Doughnut Chart Wikipedia
- How to Draw the Different Types of Pie Charts | Percentage Pie ...
- Exploded pie chart (percentage) - Template
- Exploded pie chart (percentage) - Template | Sector weightings ...
- Pie Chart Software | How to Draw the Different Types of Pie Charts ...
- Approximate composition of the air - Pie chart | Approximate ...
- How to Draw the Different Types of Pie Charts | Pie Chart Software ...
- Pie Chart Software | Doughnut chart - Template | Donut Chart ...
- Approximate composition of the air - Pie chart | Approximate ...
- Exploded pie chart - European Parliament election | European ...
- How to Draw the Different Types of Pie Charts | Pie Chart Software ...
- Pie Chart Software | How to Draw a Pie Chart Using ConceptDraw ...
- Domestic sector SWOT | Domestic garden | Pie chart - Domestic ...
- Approximate composition of the air - Pie chart | Approximate ...
- Domestic Energy Consumption By Using Pie Chart
- The Pie Chart Showing The Types Of Air
- Wikipedia Of Doughnut Chart
- Percentage Pie Chart . Pie Chart Examples | Approximate ...
- Exploded pie chart
- Approximate composition of the air - Pie chart | Percentage Pie ...