HelpDesk
How to Draw a Divided Bar Chart in ConceptDraw PRO

 Divided Bar Diagrams
The Divided Bar Diagrams Solution extends the capabilities of ConceptDraw PRO v10 with templates, samples, and a library of vector stencils for drawing high impact and professional Divided Bar Diagrams and Graphs, Bar Diagram Math, and Stacked Graph.
A divided bar chart is a rectangle divided into segments, illustrating numerical proportion. In a divided bar chart, the length of each segment (and consequently its area), is proportional to the quantity it represents.
This divided bar graph displays the number of people per day who visited swimming pool.
The divided bar diagram template for the ConceptDraw PRO diagramming and vector drawing software is included in the Divided Bar Diagrams solution from the Graphs and Charts area of ConceptDraw Solution Park.
This divided bar graph displays the number of people per day who visited swimming pool.
The divided bar diagram template for the ConceptDraw PRO diagramming and vector drawing software is included in the Divided Bar Diagrams solution from the Graphs and Charts area of ConceptDraw Solution Park.
Divided bar chart template
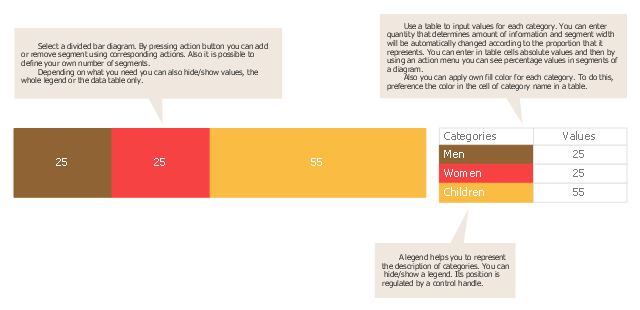
A Divided Bar graph is a rectangle divided into smaller rectangles along its length in proportion to the data. Segments in a Divided Bar represent a set of quantities according to the different proportions of the total amount.
Divided Bars are used for visual representation of the collected information.
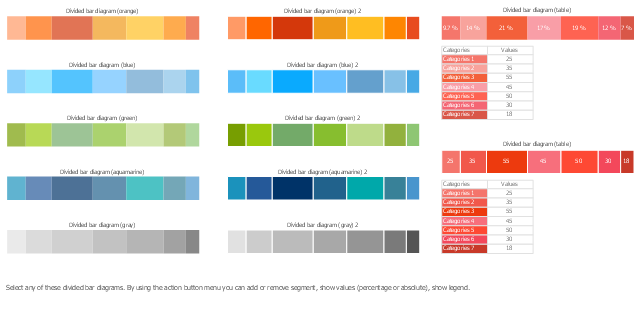
The design elements library Divided bar diagrams contains the 10 vector templates of divided bar charts.
Use the design elements library Divided bar diagrams to draw your diagrams and infographics using the ConceptDraw PRO diagramming and vector drawing software.
The example "Design elements - Divided bar diagrams" was created using ConceptDraw PRO diagramming and vector drawing software extended with the Divided Bar Diagrams solution from the Graphs and Charts area of ConceptDraw Solution Park.
Divided Bars are used for visual representation of the collected information.
The design elements library Divided bar diagrams contains the 10 vector templates of divided bar charts.
Use the design elements library Divided bar diagrams to draw your diagrams and infographics using the ConceptDraw PRO diagramming and vector drawing software.
The example "Design elements - Divided bar diagrams" was created using ConceptDraw PRO diagramming and vector drawing software extended with the Divided Bar Diagrams solution from the Graphs and Charts area of ConceptDraw Solution Park.
Divided bar chart templates
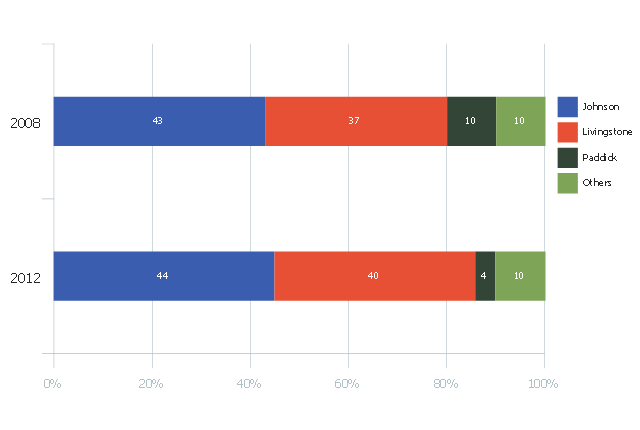
This divided bar chart sample was drawn on the base of the infographics "London Elections Results by Numbers" from the london.gov.uk website.
[data.london.gov.uk/ datastore/ package/ london-elections-results-2012-wards-boroughs-constituency]
"There are six types of elections in the United Kingdom: United Kingdom general elections, elections to devolved parliaments and assemblies, elections to the European Parliament, local elections, mayoral elections and Police and Crime Commissioner elections. Elections are held on Election Day, which is conventionally a Thursday. General elections do not have fixed dates, but must be called within five years of the opening of parliament following the last election. Other elections are held on fixed dates, though in the case of the devolved assemblies and parliaments early elections can occur in certain situations. Currently, six electoral systems are used: the single member plurality system (First Past the Post), the multi member plurality system, party list PR, the single transferable vote, the Additional Member System and the Supplementary Vote.
Elections are administered locally: in each lower-tier local authority, the actual polling procedure is run by the Returning Officer and the compiling and maintenance of the electoral roll by the Electoral Registration Officer (except in Northern Ireland, where the Electoral Office for Northern Ireland assumes both responsibilities). The Electoral Commission only sets standards for and issues guidelines to Returning Officers and Electoral Registration Officers, but is responsible for nationwide electoral administration (such as the registration of political parties and directing the administration of national referendums)." [Elections in the United Kingdom. Wikipedia]
The divided bar diagram example "London election results" was created using the ConceptDraw PRO diagramming and vector drawing software extended with the Divided Bar Diagrams solution from the Graphs and Charts area of ConceptDraw Solution Park.
Divided bar chart
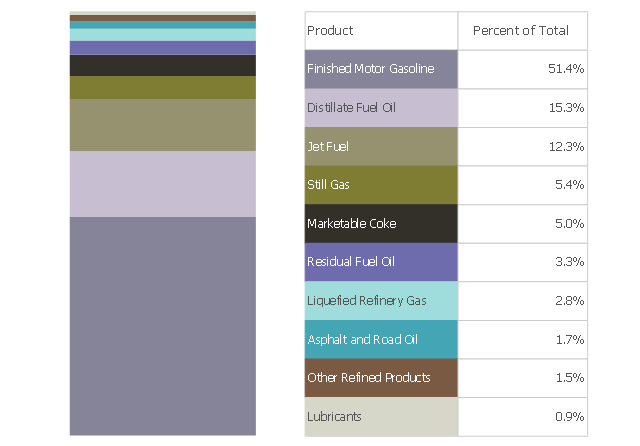
This divided bar chart example was drawn on the base of the picture "Petroleum Products Yielded from One Barrel of Crude Oil in California" from the California Energy Almanac website. [energyalmanac.ca.gov/ gasoline/ whats_ in_ barrel_ oil.html]
"Petroleum products are useful materials derived from crude oil (petroleum) as it is processed in oil refineries. Unlike petrochemicals, which are a collection of well-defined usually pure chemical compounds, petroleum products are complex mixtures. The majority of petroleum is converted to petroleum products, which includes several classes of fuels.
According to the composition of the crude oil and depending on the demands of the market, refineries can produce different shares of petroleum products. The largest share of oil products is used as "energy carriers", i.e. various grades of fuel oil and gasoline. These fuels include or can be blended to give gasoline, jet fuel, diesel fuel, heating oil, and heavier fuel oils. Heavier (less volatile) fractions can also be used to produce asphalt, tar, paraffin wax, lubricating and other heavy oils. Refineries also produce other chemicals, some of which are used in chemical processes to produce plastics and other useful materials. Since petroleum often contains a few percent sulfur-containing molecules, elemental sulfur is also often produced as a petroleum product. Carbon, in the form of petroleum coke, and hydrogen may also be produced as petroleum products. The hydrogen produced is often used as an intermediate product for other oil refinery processes such as hydrocracking and hydrodesulfurization." [Petroleum product. Wikipedia]
The divided bar diagram example "Petroleum products yielded from one barrel of crude oil" was created using the ConceptDraw PRO diagramming and vector drawing software extended with the Divided Bar Diagrams solution from the Graphs and Charts area of ConceptDraw Solution Park.
Divided bar chart
The vector stencils library "Composition charts" contains 6 templates: 2 pie charts, 2 divided bar charts and 2 double divided bar charts.
The vector stencils library "Composition indicators" contains 6 templates of visual indicators.
Use these design elements to visualize composition comparison of your data in your visual dashboard created using the ConceptDraw PRO diagramming and vector drawing software.
"A pie chart (or a circle graph) is a circular chart divided into sectors, illustrating numerical proportion. In a pie chart, the arc length of each sector (and consequently its central angle and area), is proportional to the quantity it represents. While it is named for its resemblance to a pie which has been sliced, there are variations on the way it can be presented. ...
An obvious flaw exhibited by pie charts is that they cannot show more than a few values without separating the visual encoding (the “slices”) from the data they represent (typically percentages). When slices become too small, pie charts have to rely on colors, textures or arrows so the reader can understand them. This makes them unsuitable for use with larger amounts of data. Pie charts also take up a larger amount of space on the page compared to the more flexible alternative of bar charts, which do not need to have separate legends, and can also display other values such as averages or targets at the same time. ...
Most subjects have difficulty ordering the slices in the pie chart by size; when the bar chart is used the comparison is much easier. Similarly, comparisons between data sets are easier using the bar chart. However, if the goal is to compare a given category (a slice of the pie) with the total (the whole pie) in a single chart and the multiple is close to 25 or 50 percent, then a pie chart can often be more effective than a bar graph." [Pie chart. Wikipedia]
The example "Design elements - Composition charts and indicators" is included in the Composition Dashboard solution from the area "What is a Dashboard" of ConceptDraw Solution Park.
Composition charts and visual indicators

Relative Value Chart Software

Relative values are widely used in:business, economics, investment, management, marketing, statistics, etc.
ConceptDraw PRO software is the best for drawing professional looking Relative Value Charts. ConceptDraw PRO provides Divided Bar Diagrams solution from the Graphs and Charts Area of ConceptDraw Solution Park.
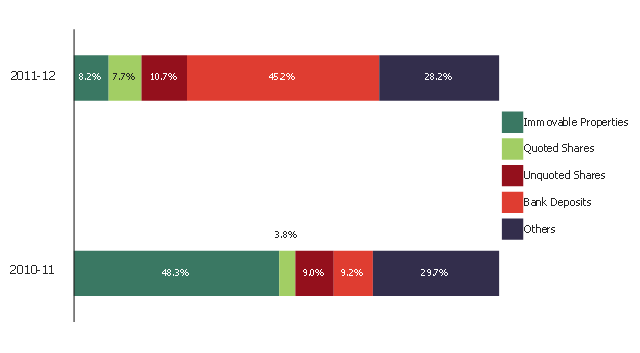
This example was created on the base of the figure "Composition of estates" from the website of the Inland Revenue Department of the Government of the Hong Kong Special Administrative Region.
[ird.gov.hk/ dar/ 2011-12/ en/ assessing.html]
"An estate is the net worth of a person at any point in time alive or dead. It is the sum of a person's assets - legal rights, interests and entitlements to property of any kind - less all liabilities at that time. The issue is of special legal significance on a question of bankruptcy and death of the person.
Depending on the particular context, the term is also used in reference to an estate in land or of a particular kind of property (such as real estate or personal estate). The term is also used to refer to the sum of a person's assets only." [Estate (law). Wikipedia]
The divided bar diagram example "Composition of estates" was created using the ConceptDraw PRO diagramming and vector drawing software extended with the Divided Bar Diagrams solution from the Graphs and Charts area of ConceptDraw Solution Park.
Divided bar chart
This divided bar chart sample was drawn on the base of the infographics "London Elections Results by Numbers" from the london.gov.uk website.
[data.london.gov.uk/ datastore/ package/ london-elections-results-2012-wards-boroughs-constituency]
"There are six types of elections in the United Kingdom: United Kingdom general elections, elections to devolved parliaments and assemblies, elections to the European Parliament, local elections, mayoral elections and Police and Crime Commissioner elections. Elections are held on Election Day, which is conventionally a Thursday. General elections do not have fixed dates, but must be called within five years of the opening of parliament following the last election. Other elections are held on fixed dates, though in the case of the devolved assemblies and parliaments early elections can occur in certain situations. Currently, six electoral systems are used: the single member plurality system (First Past the Post), the multi member plurality system, party list PR, the single transferable vote, the Additional Member System and the Supplementary Vote.
Elections are administered locally: in each lower-tier local authority, the actual polling procedure is run by the Returning Officer and the compiling and maintenance of the electoral roll by the Electoral Registration Officer (except in Northern Ireland, where the Electoral Office for Northern Ireland assumes both responsibilities). The Electoral Commission only sets standards for and issues guidelines to Returning Officers and Electoral Registration Officers, but is responsible for nationwide electoral administration (such as the registration of political parties and directing the administration of national referendums)." [Elections in the United Kingdom. Wikipedia]
The divided bar diagram example "London election results" was created using the ConceptDraw PRO diagramming and vector drawing software extended with the Divided Bar Diagrams solution from the Graphs and Charts area of ConceptDraw Solution Park.
[data.london.gov.uk/ datastore/ package/ london-elections-results-2012-wards-boroughs-constituency]
"There are six types of elections in the United Kingdom: United Kingdom general elections, elections to devolved parliaments and assemblies, elections to the European Parliament, local elections, mayoral elections and Police and Crime Commissioner elections. Elections are held on Election Day, which is conventionally a Thursday. General elections do not have fixed dates, but must be called within five years of the opening of parliament following the last election. Other elections are held on fixed dates, though in the case of the devolved assemblies and parliaments early elections can occur in certain situations. Currently, six electoral systems are used: the single member plurality system (First Past the Post), the multi member plurality system, party list PR, the single transferable vote, the Additional Member System and the Supplementary Vote.
Elections are administered locally: in each lower-tier local authority, the actual polling procedure is run by the Returning Officer and the compiling and maintenance of the electoral roll by the Electoral Registration Officer (except in Northern Ireland, where the Electoral Office for Northern Ireland assumes both responsibilities). The Electoral Commission only sets standards for and issues guidelines to Returning Officers and Electoral Registration Officers, but is responsible for nationwide electoral administration (such as the registration of political parties and directing the administration of national referendums)." [Elections in the United Kingdom. Wikipedia]
The divided bar diagram example "London election results" was created using the ConceptDraw PRO diagramming and vector drawing software extended with the Divided Bar Diagrams solution from the Graphs and Charts area of ConceptDraw Solution Park.
Divided bar chart
This example was created on the base of the figure "Composition of estates" from the website of the Inland Revenue Department of the Government of the Hong Kong Special Administrative Region.
[ird.gov.hk/ dar/ 2011-12/ en/ assessing.html]
"An estate is the net worth of a person at any point in time alive or dead. It is the sum of a person's assets - legal rights, interests and entitlements to property of any kind - less all liabilities at that time. The issue is of special legal significance on a question of bankruptcy and death of the person.
Depending on the particular context, the term is also used in reference to an estate in land or of a particular kind of property (such as real estate or personal estate). The term is also used to refer to the sum of a person's assets only." [Estate (law). Wikipedia]
The divided bar diagram example "Composition of estates" was created using the ConceptDraw PRO diagramming and vector drawing software extended with the Divided Bar Diagrams solution from the Graphs and Charts area of ConceptDraw Solution Park.
[ird.gov.hk/ dar/ 2011-12/ en/ assessing.html]
"An estate is the net worth of a person at any point in time alive or dead. It is the sum of a person's assets - legal rights, interests and entitlements to property of any kind - less all liabilities at that time. The issue is of special legal significance on a question of bankruptcy and death of the person.
Depending on the particular context, the term is also used in reference to an estate in land or of a particular kind of property (such as real estate or personal estate). The term is also used to refer to the sum of a person's assets only." [Estate (law). Wikipedia]
The divided bar diagram example "Composition of estates" was created using the ConceptDraw PRO diagramming and vector drawing software extended with the Divided Bar Diagrams solution from the Graphs and Charts area of ConceptDraw Solution Park.
Divided bar chart
A Divided Bar graph is a rectangle divided into smaller rectangles along its length in proportion to the data. Segments in a Divided Bar represent a set of quantities according to the different proportions of the total amount.
The example "Divided bar graph - Global natural gas consumption (2010)" was drawn on the base of International Energy Statistics from the U.S. Energy Information Administration (EIA) website. [eia.gov/ cfapps/ ipdbproject/ IEDIndex3.cfm?tid=3&pid=26&aid=2]
"Natural gas is a fossil fuel formed when layers of buried plants and animals are exposed to intense heat and pressure over thousands of years. The energy that the plants originally obtained from the sun is stored in the form of chemical bonds in natural gas. Natural gas is a nonrenewable resource because it cannot be replenished on a human time frame. Natural gas is a hydrocarbon gas mixture consisting primarily of methane, but commonly includes varying amounts of other higher alkanes and even a lesser percentage of carbon dioxide, nitrogen, and hydrogen sulfide. Natural gas is an energy source often used for heating, cooking, and electricity generation. It is also used as fuel for vehicles and as a chemical feedstock in the manufacture of plastics and other commercially important organic chemicals." [Natural gas. Wikipedia]
The diagram example "Divided bar graph - Global natural gas consumption (2010)" was created using ConceptDraw PRO diagramming and vector drawing software extended with the Divided Bar Diagrams solution from the Graphs and Charts area of ConceptDraw Solution Park.
Divided bar chart
---divided-bar-graph.png--diagram-flowchart-example.png)
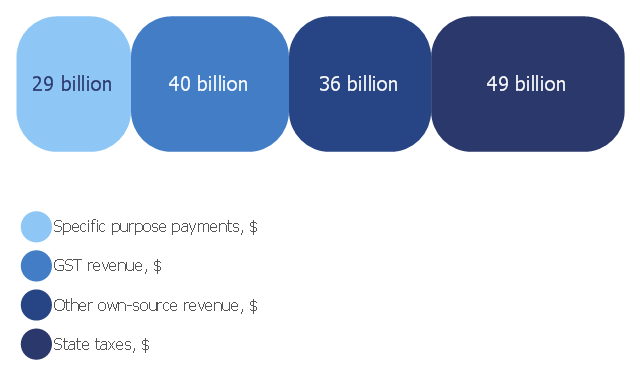
This divided bar diagram example was drawn on the base of the chart "Composition of state government revenue in 2006‑07" from the Australia's future tax system website.
[taxreview.treasury.gov.au/ content/ Paper.aspx?doc=html/ publications/ papers/ report/ section_ 10-06.htm]
"Government revenue is money received by a government. It is an important tool of the fiscal policy of the government and is the opposite factor of government spending. Revenues earned by the government are received from sources such as taxes levied on the incomes and wealth accumulation of individuals and corporations and on the goods and services produced, exported and imported from the country, non-taxable sources such as government-owned corporations' incomes, central bank revenue and capital receipts in the form of external loans and debts from international financial institutions." [Government revenue. Wikipedia]
The divided bar diagram example "Composition of state government revenue in 2006‑07" was created using the ConceptDraw PRO diagramming and vector drawing software extended with the Divided Bar Diagrams solution from the Graphs and Charts area of ConceptDraw Solution Park.
Divided bar chart
This example visual dashboard example shows website traffic metrics. Divided bar chart and pie chart are used to visualize compositional data. Scatter plot is used to visually analyse correlation between two data sets.
"Web traffic is the amount of data sent and received by visitors to a web site. ...
This is determined by the number of visitors and the number of pages they visit. Sites monitor the incoming and outgoing traffic to see which parts or pages of their site are popular and if there are any apparent trends, such as one specific page being viewed mostly by people in a particular country. There are many ways to monitor this traffic and the gathered data is used to help structure sites, highlight security problems or indicate a potential lack of bandwidth not all web traffic is welcome. Some companies offer advertising schemes that, in return for increased web traffic (visitors), pay for screen space on the site. Sites also often aim to increase their web traffic through inclusion on search engines and through search engine optimization." [Web traffic. Wikipedia]
The example "Website traffic dashboard" was created using the ConceptDraw PRO diagramming and vector drawing software extended with the Corellation Dashboard solution from the area "What is a Dashboard" of ConceptDraw Solution Park.
Visual dashboard

Bar Diagram Math

Chart Software for Better Presentations

Graphs and Charts Area provide a wide collection of professional looking predesigned templates, samples and ready-to-use vector stencils that will help you to draw the charts and diagrams of various types: Pie Charts, Donut Charts, Line Charts, Column Charts, Bar Charts, Pyramids, Scatter Charts, Venn Diagrams, Spider Charts, Area Charts, Divided Bar Graphs.
 Composition Dashboard
Composition dashboard solution extends ConceptDraw PRO software with templates, samples and vector stencils library with charts and indicators for drawing visual dashboards showing data composition.
 Basic Diagramming
This solution extends ConceptDraw PRO software with the specific tools you need to easily draw flowcharts, block diagrams, histograms, pie charts, divided bar diagrams, line graphs, circular arrows diagrams, Venn diagrams, bubble diagrams and concept maps
Basic Diagramming


Pie Chart Examples and Templates

Pie chart examples and templates created using ConceptDraw PRO software helps you get closer with pie charts and find pie chart examples suite your needs.
- How to Draw a Divided Bar Chart in ConceptDraw PRO | Divided ...
- Divided Bar Diagrams | Work Flow Process Chart | Process ...
- Design elements - Divided bar diagrams
- Divided bar diagram - London election results | Relative Value Chart ...
- Divided bar diagram template
- Bar Chart Software | Bar Chart Examples | How to Draw a Divided ...
- The Best Drawing Program for Mac | Divided Bar Diagrams | Visual ...
- Divided Bar Diagrams
- Divided Bar Diagrams | Basic Diagramming | Design elements ...
- Divided bar diagram template | Design elements - Divided bar ...
- Bar Chart Software | Bar Chart Examples | Bar chart template | _bar ...
- Divided bar diagram template
- Exploded pie chart - European Parliament election | Divided bar ...
- Divided Bar Diagrams | Bar Graphs | Graphs and Charts Area ...
- Bar Graphs | Picture Graphs | Divided Bar Diagrams | Bar Graphs On ...
- Bar Chart Template
- Divided Bar Diagrams | How to Draw a Divided Bar Cahrt ...
- Bar Chart Template for Word
- Divided bar chart
- Bar Graphs | Bar Chart Software | Bar Chart Examples | Bar Diagram