 Divided Bar Diagrams
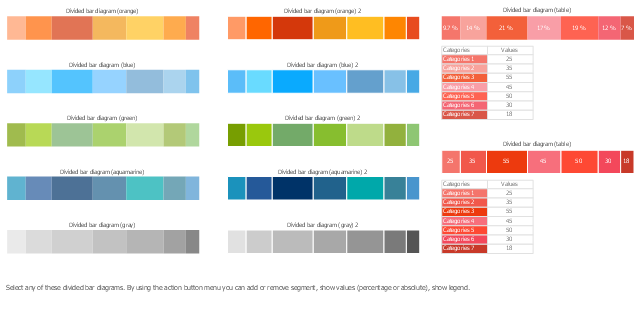
The Divided Bar Diagrams Solution extends the capabilities of ConceptDraw PRO v10 with templates, samples, and a library of vector stencils for drawing high impact and professional Divided Bar Diagrams and Graphs, Bar Diagram Math, and Stacked Graph.
A divided bar diagram is a rectangle divided into segments along its length. The segment sizes represent percent composition of one total consisting of few parts.
The vector stencils library "Divided bar diagrams" contains 12 chart templates.
Use it to draw your diagrams and infographics using the ConceptDraw PRO diagramming and vector drawing software.
The chart templates example "Design elements - Divided bar diagrams" is included in the Divided Bar Diagrams solution from the Graphs and Charts area of ConceptDraw Solution Park.
Templates
 Basic Diagramming
This solution extends ConceptDraw PRO software with the specific tools you need to easily draw flowcharts, block diagrams, histograms, pie charts, divided bar diagrams, line graphs, circular arrows diagrams, Venn diagrams, bubble diagrams and concept maps
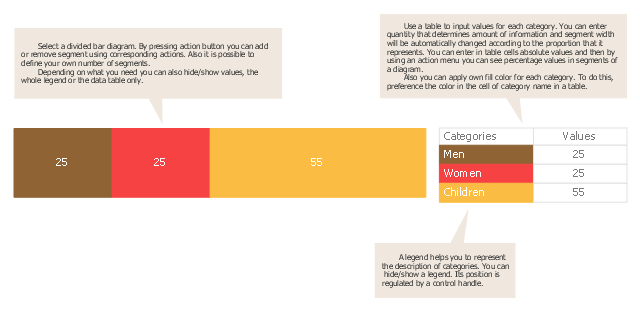
Use this chart template to design your divided bar diagrams.
A divided bar chart is a rectangle divided into segments, illustrating numerical proportion. In a divided bar chart, the length of each segment (and consequently its area), is proportional to the quantity it represents.
This divided bar graph displays the number of people per day who visited swimming pool.
The template "Divided bar diagram" for the ConceptDraw PRO diagramming and vector drawing software is included in the Divided Bar Diagrams solution from the Graphs and Charts area of ConceptDraw Solution Park.
Template
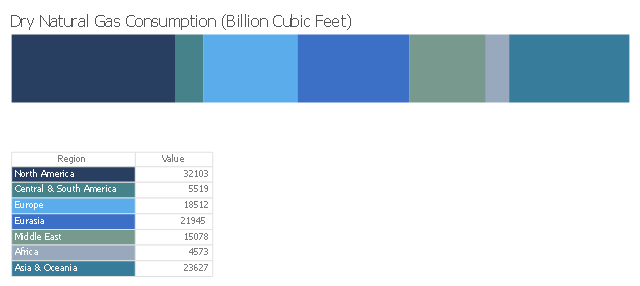
This divided bar diagram sample shows the global natural gas consumption by regions in 2013. It was designed using data of the International Energy Statistics webpage from the U.S. Energy Information Administration (EIA) website. [eia.gov/ cfapps/ ipdbproject/ IEDIndex3.cfm?tid=3&pid=26&aid=2]
"Natural gas is a fossil fuel formed when layers of buried plants and animals are exposed to intense heat and pressure over thousands of years. The energy that the plants originally obtained from the sun is stored in the form of chemical bonds in natural gas. Natural gas is a nonrenewable resource because it cannot be replenished on a human time frame. Natural gas is a hydrocarbon gas mixture consisting primarily of methane, but commonly includes varying amounts of other higher alkanes and even a lesser percentage of carbon dioxide, nitrogen, and hydrogen sulfide. Natural gas is an energy source often used for heating, cooking, and electricity generation. It is also used as fuel for vehicles and as a chemical feedstock in the manufacture of plastics and other commercially important organic chemicals." [Natural gas. Wikipedia]
The chart example "Global natural gas consumption" was created using ConceptDraw PRO diagramming and vector drawing software extended with the Divided Bar Diagrams solution from the Graphs and Charts area of ConceptDraw Solution Park.
Divided bar chart
 Universal Diagramming Area
This area collects solutions for drawing diagrams, charts, graphs, matrices, geographic and road maps for education, science, engineering, business.
- Divided bar diagram template
- Divided bar diagram template | Design elements - Divided bar ...
- The Best Drawing Program for Mac | Divided Bar Diagrams | Visual ...
- Divided Bar Diagrams | Work Flow Process Chart | Process Flowchart |
- Bar Graphs | Picture Graphs | Divided Bar Diagrams |
- Bar chart template | Double bar graph template | Divided bar ...
- Bar Chart Examples | Divided bar diagram template | Bar Chart ...
- Divided bar diagram template | Divided bar graph - Global natural ...
- Divided bar graph - Global natural gas consumption (2010) | Divided ...
- Divided Bar Diagrams | Divided bar graph - Global natural gas ...
- Divided Bar Diagrams | Basic Diagramming | Divided bar graph ...
- Basic Diagramming | Arrow circle chart template | How to Draw a ...
- Bar Graphs | Bar Diagrams for Problem Solving. Create event ...
- Basic Diagramming | Business diagrams & Org Charts with ...
- Basic Diagramming | Design Element: Basic Network for Network ...
- Venn diagrams with ConceptDraw PRO | Best Diagramming ...
- Divided bar graph - Global natural gas consumption (2010) | Bar ...
- Bar Diagrams for Problem Solving. Create economics and financial ...
- Circular arrows diagram
- Basic Diagramming | The Best Drawing Program for Mac | Block ...