This site uses cookies. By continuing to browse the ConceptDraw site you are agreeing to our Use of Site Cookies.

Basic Flowchart Symbols and Meaning

Flowchart Symbols and Meaning - Provides a visual representation of basic flowchart symbols and their proposed use in professional workflow diagram, standard process flow diagram and communicating the structure of a well-developed web site, as well as their correlation in developing on-line instructional projects. See flowchart's symbols by specifics of process flow diagram symbols and workflow diagram symbols.
How to Build a Flowchart

Entity Relationship Diagram Symbols

Creating an entity-relationship (ER) model is to visually represent the structure of a business database, where data equates to entities (or objects) that are linked by defined relationships expressing dependencies and requirements. By nature it is an abstract visualization, the first step in the design process towards creating a logical and functional database.
ERD symbols used for professional ERD drawing are collected in libraries from the Entity-Relationship Diagram (ERD) solution for ConceptDraw DIAGRAM.

Flowchart Definition

Flowchart definition - A Flowchart is a graphically representation of the structure of process or system, algorithm or the step-by-step solution of the problem. The Flowchart describes the flow of data through an information processing systems and the parts of the flows. The flow is a set of the logic operations that meet the certain requirements.

Samples of Flowchart

This sample shows the Flowchart of the testing the work of the lamp and decision making about what to do to lamp will work.

Cross Functional Flowchart Symbols

The excellent possibility to create attractive Cross Functional Flowcharts for step-by-step visualization the operations of a business process flow of any degree of detailing is offered by ConceptDraw’s Cross-Functional Flowcharts solution. The extensive selection of commonly used vector cross functional flowchart symbols allow you to demonstrate the document flow in organization, to represent each team member’s responsibilities and how processes get shared or transferred between different teams and departments.

Audit Flowchart Symbols

Audit Flowchart helps you draw auditing diagrams for accounting, finance and money management, fiscal information tracking, decision making flow charts, financial inventories and documenting Six Sigma and ISO 9000 business processes.
Audit Flowchart Symbols - It’s efficiently to use the colors creating the audit flowcharts to make them bright, visual, attractive and successful. The best flowchart maker use ConceptDraw DIAGRAM features of RapidDraw technique.

Flowchart Programming Project. Flowchart Examples

Flowcharts can be used in designing and documenting both simple and complex processes or programs and, similar to the other types of diagrams, they can help visualize what happens and so help understand some definite process, and, as a result, find flaws, bottlenecks and other features within it.

How To Make the Right Decision in Projects

A key point of conference success is the ability to see slides in real time, and hold documented discussions during the meeting. Remote Presentation for Skype is a new solution allows real-time presenting that benefits work groups who need collaborate by web meetings.

Process Flow Chart Symbol

Process Flow Charts are very popular and widely used in chemical and process engineering for representation a general flow of plant processes and equipment. If you need often draw them, the ConceptDraw DIAGRAM diagramming and vector drawing software extended with tools of Flowcharts Solution will be useful for you.
The mostly used set of process flow chart symbols includes the following: Rectangle (box) process flow chart symbol, Rounded rectangle, Circle, Diamond.

Definition Flowchart

A flowchart is a type of diagram that represents an algorithm, workflow or process, showing the steps as boxes of various kinds, and their order by connecting them with arrows.
This definition flowchart gives a clear answer for the question "What is a flowchart?". It is convenient to use a powerful ConceptDraw DIAGRAM software extended with Flowcharts Solution from the "Diagrams" Area of ConceptDraw Solution Park to design flowcharts of various types which will additionally illustrate a definition flowchart.

Value Stream Mapping Symbols

VSM symbols are the best for a production process designing. The entire Value Stream Mapping method uses a graphical representation of the manufacturing process, factors' pros and cons, that all stakeholders can easily understand. Value Stream Mapping is a graphical technique that provides possibilities to improve analysis of a manufacturing process, at the stage of the transferring information or materials that required to deliver a product or service to the customer.

Samples of Flowcharting

This sample shows the Flowchart for determine is a species heterotroph or autotroph, or a subtype. This diagram has start point and end points. The diamonds on the Flowchart represent the decisions. The Flowcharts are widely used in science, analytics, government, politics, business, engineering, architecture, marketing, manufacturing, administration, etc.
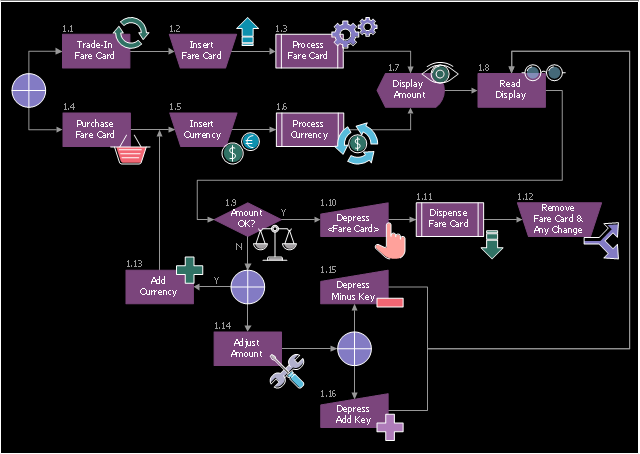
This example of decision diagram for subway fare card machine was designed on the base of the Wikimedia Commons file: Subway Fare Card Machine Decision Diagram.jpg.
"Decision/ Action Diagrams - These diagrams are similar to functional flows except that decision points are added. Each function is expressed as a "verb-noun" combination with occasional adjectives or other modifiers. Each decision point is placed in a diamond-shaped outline symbol and written in question form. The question must be binary, answerable by a "yes" or "no" response. Both functional action blocks and decision diamonds are labeled with reference numbers, similar to those used for functional flow diagrams. These are necessary to ensure traceability."
[commons.wikimedia.org/ wiki/ File:Subway_ Fare_ Card_ Machine_ Decision_ Diagram.jpg]
The example "Subway fare card machine decision diagram" was designed using ConceptDraw software extended with Decision Making solution from Management area of ConceptDraw Solution Park.
Decision diagram example
Decision diagram example, vertical moving arrow, tools, subroutine, predefined process, shopping basket, scales, process step, plus, or, minus sign, manual operation, manual input, looping arrows, hand pointer, glasses, eyeglasses, gears, eye, euro symbol, double arc arrow, dollar sign, display, decision, bifurcation,

Decision Making Software For Small Business

A software tool that saves your time on making decisions now has the ability to make decisions with remote team via Skype.

Best Program to Create a Fowchart

ConceptDraw - feature-rich flowchart software allows you create professional looking flowcharts.

Flowchart Components

The ConceptDraw Flowchart component includes a set of samples and templates. This geathered as flowchart maker toolbox which focused on drawing flowcharts of any industry standards.

Technical Flow Chart

Flow chart is a diagrammatic representation of an algorithm and essential part of planning the system. Flow charts are widely used in technical analysis and programming for easy writing programs and explaining them to others. So, one of the most popular type of flow charts is Technical Flow Chart.
Technical Flow Chart can be drawn by pencil on the paper, but it will be easier to use for designing a special software. ConceptDraw DIAGRAM diagramming and vector drawing software extended with Flowcharts Solution from the "Diagrams" Area of ConceptDraw Solution Park will be useful for this goal.

Flowchart

With ConceptDraw DIAGRAM it is easy to create professional flowchart diagrams of any complexity. With the use of numerous templates and the extensive libraries of ready-made symbols and blocks; depicting your business processes has never been easier.

Decision Making

Decision Making - ConceptDraw OFFICE suite provides visual tools that are given support on the stage of the decision making.
The Seven Management and Planning Tools is a set for such diagrams: Affinity Diagram, Relations Diagram, Prioritization Matrix, Root Cause Tree Diagram, Involvement Matrix, PERT Chart, Risk Diagram (PDPC).

Business Process Workflow Diagram

Business Process Workflow Diagram is a professional visual tool that is widely applied for business development, business analysis, business process optimization and documenting business processes. Business Process Workflow Diagram lets depict in details the steps of business processes and flow of tasks between them, the execution of business processes, transfer of data and documents.
The workflows on the Business Process Workflow Diagram are represented using the set of common symbols which let easy illustrate business processes and process flows, depict the start, all major steps and end of the process, what data are used by the process, how the data flow through the business areas within scope of our project, how the tasks are executed and by who, and how workers interact with each other.
How to Draw Business Process Diagrams