This site uses cookies. By continuing to browse the ConceptDraw site you are agreeing to our Use of Site Cookies.
HelpDesk

How to Add a Block Diagram to a PowerPoint Presentation

Block diagram is a rather universal type of charts - compositions from geometric blocks can be applied to describe various kinds of processes or systems, consisting of components, which depend on each other. Block diagrams are indispensable when you need to represent a processor system on a basic level. With blocks, you can easily depict the basic elements of the process, without drilling down. The PowerPoint presentation of major process steps and key process participants can be very informative and helpful. Using ConceptDraw DIAGRAM, you can easily convert a block diagram to an MS PowerPoint presentation.
HelpDesk

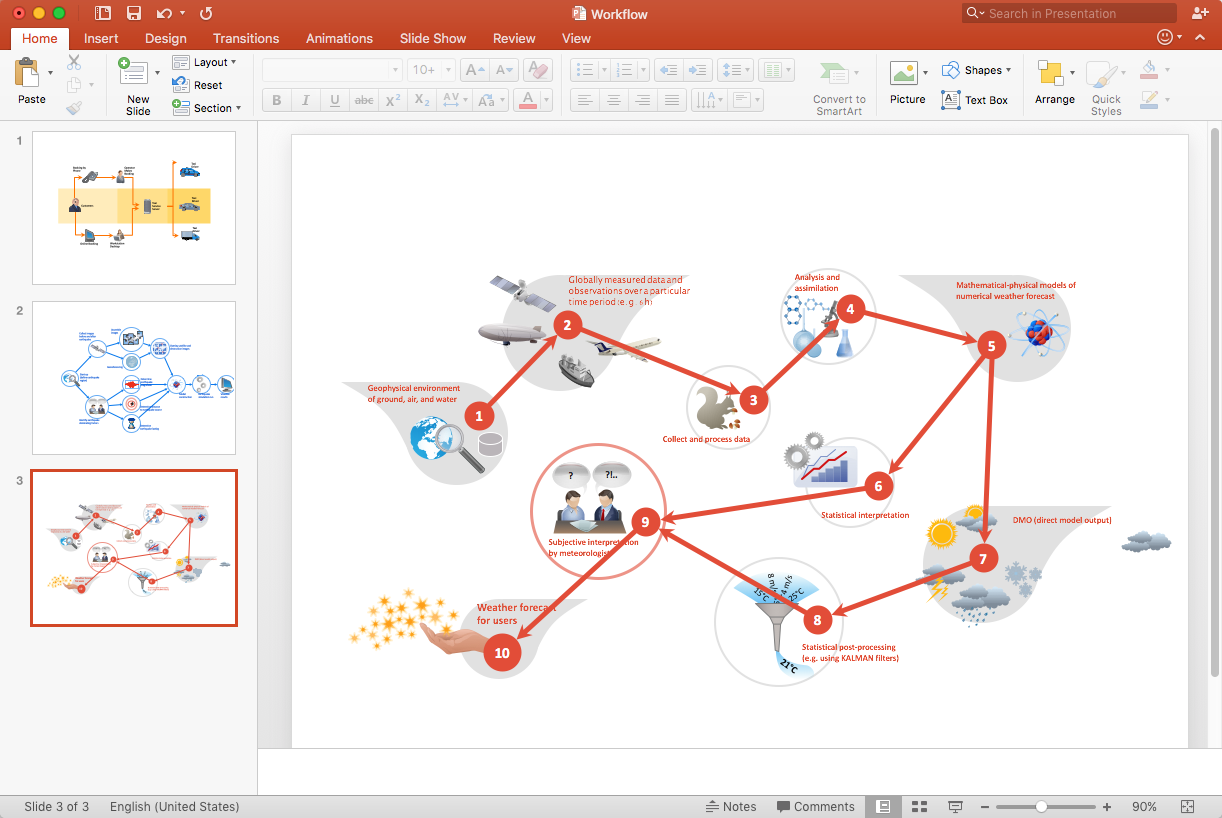
How to Add a Workflow Diagram to a PowerPoint Presentation

Making workflow diagrams in PowerPoint can help to describe the process within your organization as well as making comprehensive analysis presentations for sales or management and also can be used in other presentations and business documentation.
HelpDesk

How to Add a Circle-spoke Diagram to PowerPoint

ConceptDraw DIAGRAM can be used as a tool for creating circle spoke diagrams along with other marketing diagrams. ConceptDraw DIAGRAM allows you to make an MS PowerPoint Presentation from your marketing diagrams in a few simple steps.
HelpDesk

How to Add a Telecommunication Network Diagram to a PowerPoint Presentation

Telecommunication network diagram represents a system consisting of computers, servers, telecommunication devices, switches, satellites, wireless transmitters, antennas, cables, etc., that link a set of remote nodes. It also describes a telephone exchange, that connects calls between landlines. ConceptDraw DIAGRAM allows you to easily create telecommunication network diagrams and then make a PowerPoint Presentation from your network documentation in a few clicks. Telecommunication network diagrams are used to show components and connections in a telecommunications network: how they are interacted between each other and with end-users. The PowerPoint presentation on the concept of telecom network can be very informative and helpful. ConceptDraw DIAGRAM allows you to make an MS PowerPoint Presentation from your telecommunication network diagrams in a few clicks.
HelpDesk

How to Add a Bubble Diagram to PowerPoint Presentation

Bubble diagrams can be used to compare concepts and identify areas of similarity and difference. ConceptDraw DIAGRAM allows you to make an MS PowerPoint Presentation from your charts in a few simple steps. A bubble diagram is a chart that represents information visually in the form of a series of bubbles. Bubble charts are often used in marketing and management during the early stages of product development to visualize ideas and concepts by organizing them in a hierarchy. The ability to create this form of a diagram is contained within the Bubble Diagrams solution. A PowerPoint presentation of bubble diagrams can be used to demonstrate and identify areas of similarity and difference of featured business ideas and concepts.
HelpDesk

How to Add a Wireless Network Diagram to a PowerPoint Presentation

The PowerPoint presentation of a wireless network can be very informative. ConceptDraw DIAGRAM allows you to easily create wireless network diagrams and then make a PowerPoint Presentation from your diagrams in a single click.
HelpDesk

How To Add a Computer Network Diagram to a PowerPoint Presentation

The PowerPoint presentation of the computer network can be very informative. ConceptDraw DIAGRAM allows you to easily create computer network diagrams and then make a PowerPoint Presentation from your network diagrams in a single click.
HelpDesk

How to Add a Fishbone Diagram to PowerPoint Presentation

Fishbone (Ishikawa) diagram is often used in business to determine the cause of some problems. The easiest way to draw a Fishbone diagram is using ConceptDraw Fishbone Diagram solution.
HelpDesk

How to Add a Rack Diagram to a PowerPoint Presentation

Rack diagrams are created to make short work of configuring and documenting the server and network equipment of the rack frameworks. Rack diagrams may be useful when considering equipment purchasing or installing. Using the ConceptDraw Rack Diagrams solution, you can quickly and easily design a rack diagram from the set of vector graphics objects that are fully consistent with accepted industry standards. The Rack diagram will help you when considering and purchasing a rack of network equipment. When installing equipment, a rack diagram will help you to situate equipment quickly and in a due manner.
The PowerPoint presentation on the concept of your server room rack layouts can be very informative and helpful. ConceptDraw DIAGRAM allows you to easily create wireless network diagrams and then make a PowerPoint Presentation from your diagrams in a single click.

Data Flow Diagram

Data flow diagram (DFD) is the part of the SSADM method (Structured Systems Analysis and Design Methodology), intended for analysis and information systems projection. Data flow diagrams are intended for graphical representation of data flows in the information system and for analysis of data processing during the structural projection. Data flow diagram often used in connection with human process and can be displayed as workflow diagram. The critical Process Flow Diagram is another flowchart technique for designing data flow in connection with organizational processes. The critical Process flow diagram may use different range of symbols than a classic workflow diagram.

Bubble diagrams with ConceptDraw DIAGRAM

Using ConceptDraw you will be able to create bubble diagrams from the ready ConceptDraw library objects or make your own objects. The created diagram can be saved and edited, objects can be moved and links between them will be automatically repainted after object moving because of using the ConceptDraw connectors.
HelpDesk

How to Perform a Presentation on Mac Using Two Monitors

ConceptDraw DIAGRAM supports multiple monitors. You can to edit a presentation and then display it on separate monitors.

presentation, powerpoint, process, mindmap mind map, mindmapping tools, solution park Presentation Exchange

presentation, powerpoint, process, mindmap mind map, mindmapping tools, solution park
This solution extends ConceptDraw MINDMAP software with the ability to import presentations from Microsoft PowerPoint, as well as enhancing its existing presentation capabilities.

block diagram, function blocks Block Diagrams

block diagram, function blocks
Block diagrams solution extends ConceptDraw DIAGRAM software with templates, samples and libraries of vector stencils for drawing the block diagrams.