This site uses cookies. By continuing to browse the ConceptDraw site you are agreeing to our Use of Site Cookies.

Workflow Diagram

Workflow diagram visually describes an repeatable pattern of organizational activity powered by resources. Workflow diagram explains and document the process flow which needs to be organized or exists and needs to be learned and executed. Workflow diagram can be part of project documentation, company policies or sertification process to comply a standard.

The workflow represents the transferring of data, documents or tasks during a work process. To make it easier to study and analyze working processes, and to present them in a simple visual manner, workflow diagrams are used. To create these diagrams professional use workflow diagram maker software ConceptDraw DIAGRAM.
HelpDesk

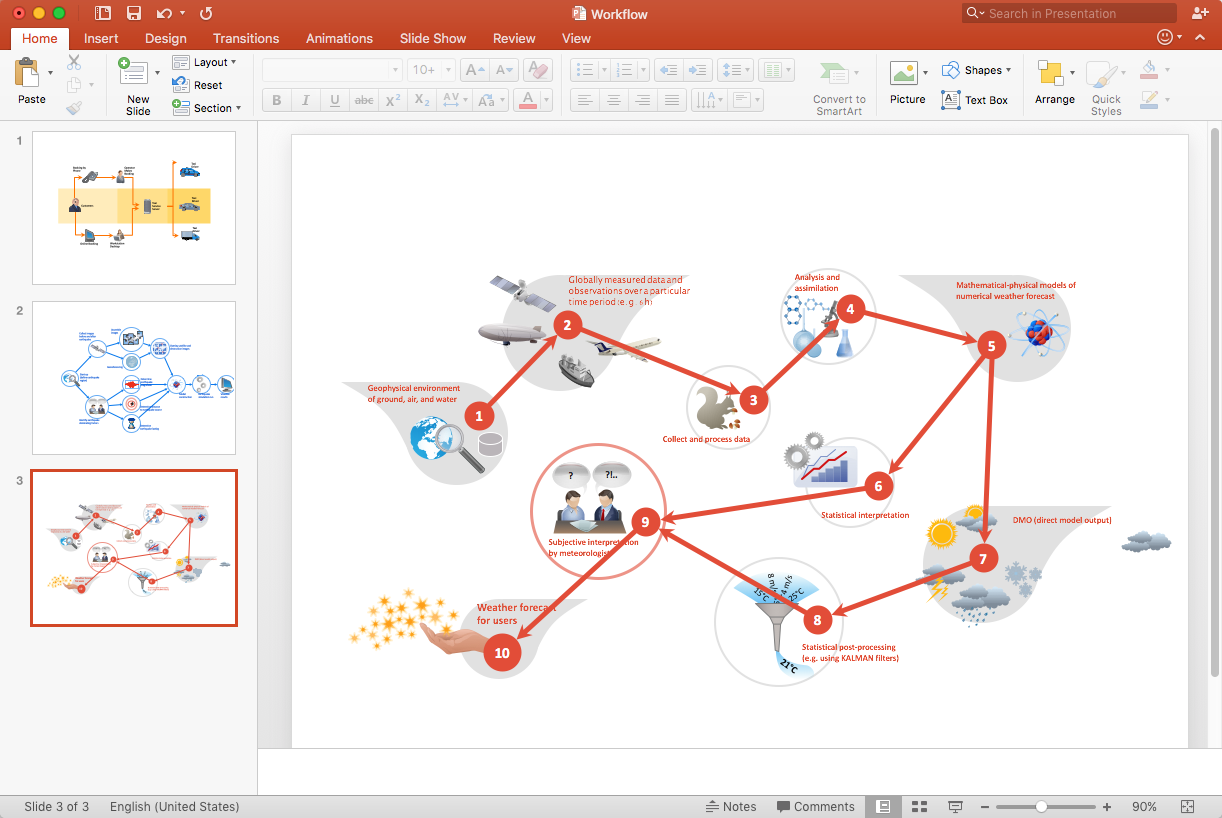
How to Add a Workflow Diagram to a PowerPoint Presentation

Making workflow diagrams in PowerPoint can help to describe the process within your organization as well as making comprehensive analysis presentations for sales or management and also can be used in other presentations and business documentation.

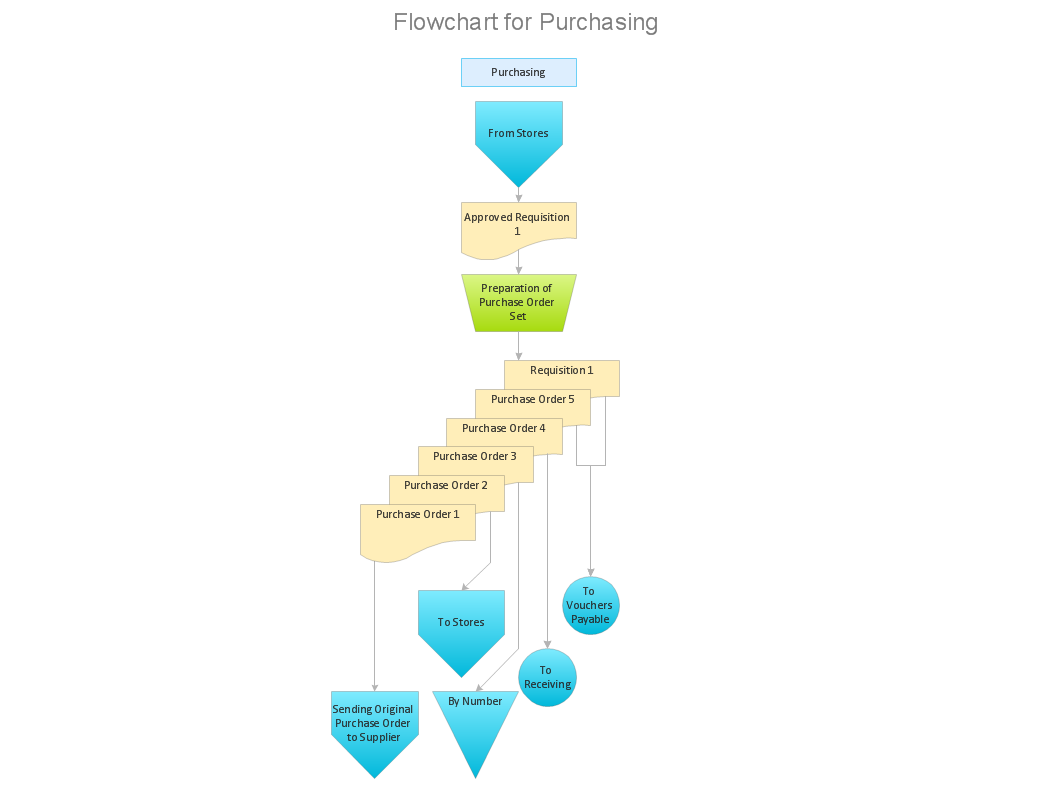
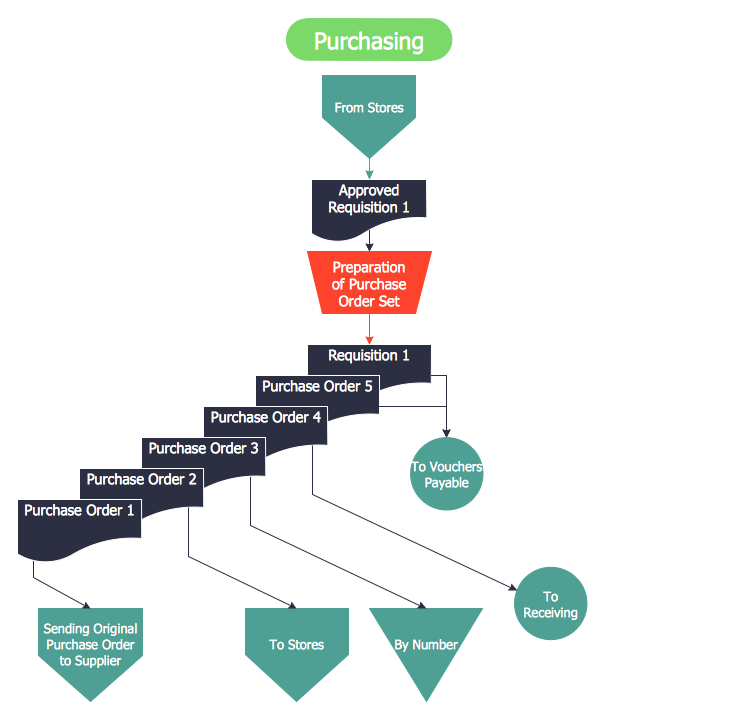
Workflow to Make a Purchase. Accounting Flowchart Example

Purchasing Workflow Chart as a methods for documenting accounting information systems. Symbols and Methods for designing Accounting System.

accounting flowchart, accounting cycle, what is the accounting cycle, accounts payable process flow chart, accounts payable flowchart, steps of accounting cycle, accounting flowchart Accounting Flowcharts

accounting flowchart, accounting cycle, what is the accounting cycle, accounts payable process flow chart, accounts payable flowchart, steps of accounting cycle, accounting flowchart
Accounting Flowcharts solution extends ConceptDraw DIAGRAM software with templates, samples and library of vector stencils for drawing the accounting flow charts.

Workflow Diagram Symbols

Workflow diagrams is the acknowledged method to draw processes which have concerted set of symbols you use for depicting different kind of steps or relations. Often it named the process flow diagram but the real process flow diagram use differen visual notations and use different flowchart symbols. The professional workflow diagram also may be used for the same purpose as critical process flow diagram. Nevertheless, there are lots of cases you may need make your workflow diagram more bright and graphic. ConceptDraw DIAGRAM extended with the Workflow Diagram solution delivers rich set of workflow diagram symbols helps you make your workflow better-suited for presentations.
HelpDesk

How to Create an Accounting Flowchart

An Accounting flowchart is a specialized type of flowchart. With the help of an accounting flowchart, you can visually describe tasks, documents, people responsible for execution at each stage of the accounting workflow. Find out how you can easily create an accounting flowchart of any complexity using Accounting Flowchart Solution from the ConceptDraw Solution Park.

workflow diagram software, workflow patterns Workflow Diagrams

workflow diagram software, workflow patterns
Workflow Diagrams solution extends ConceptDraw DIAGRAM software with samples, templates and vector stencils library for drawing the work process flowcharts.

ConceptDraw Solution Park ConceptDraw Solution Park

ConceptDraw Solution Park
ConceptDraw Solution Park collects graphic extensions, examples and learning materials

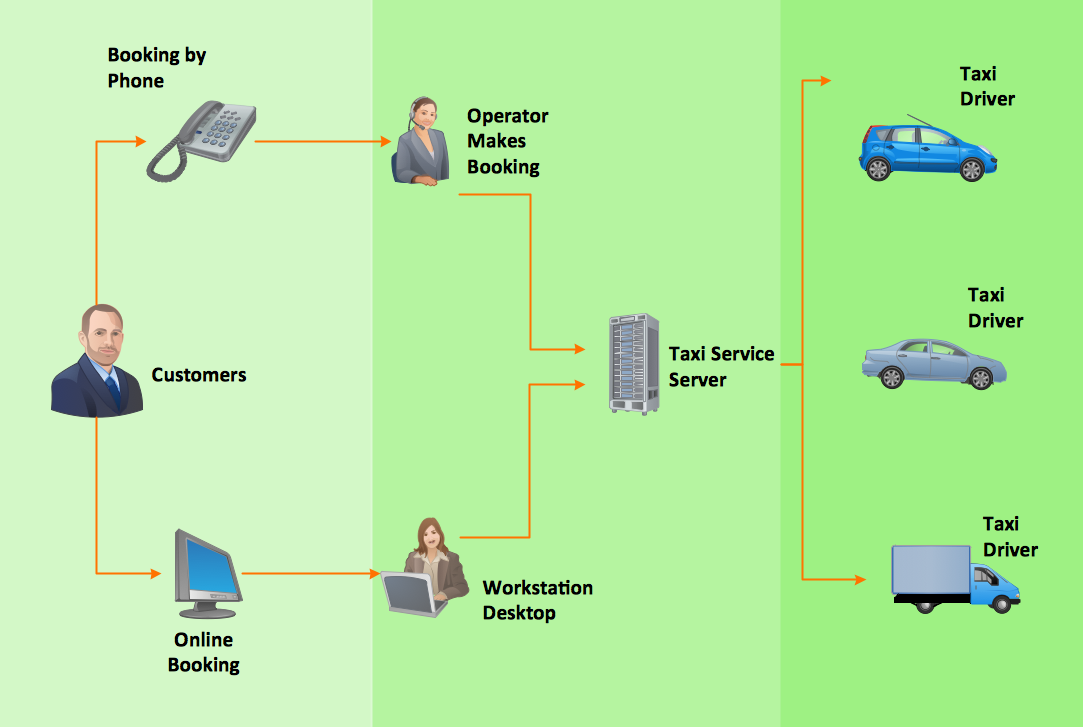
Workflow Process Example

One of the most popular option helps to draw diagrams faster is pre-designed set of examples related to each kind of diagram. ConceptDraw DIAGRAM software extended with the Workflow Diagrams solution delivers a complete set of workflow process examples helps you to start making your own workflow faster.

Workflow Application

ConceptDraw DIAGRAM application is perfect for creating workflow diagrams. This application contains specific features and technologies designed to draw diagrams faster, such as RapidDraw and Arrows10. ConceptDraw DIAGRAM software extended with the Workflow Diagrams solution gives you a flexible tool to draw any kind of workflow.

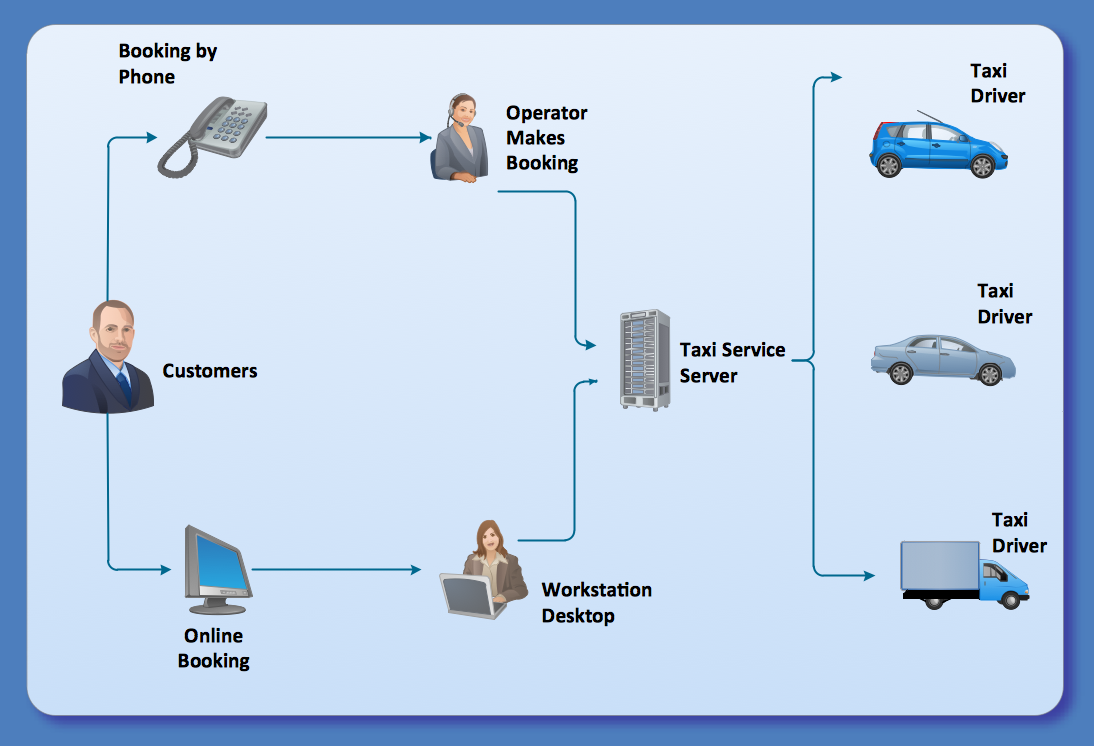
Tools and Software to Improve Your Workflow

The first step to improve your workflow is to draw it down. When the workflow is visualised you are able to analyse it, to find excess or missing steps or relations. Changing the workflow on paper you can pass as many iterations as needed to get the optimal process, and then start implementing changes to the real process. The best software helps you with workflow is ConceptDraw DIAGRAM software extended with the Workflow Diagram solution. It contains all tools, features, samples and templates you may need during drawing workflow, analysis, and then presenting and implementing your results.

cross-functional flowchart, workflow, process chart, IDEF0, timeline, calendar, Gantt chart, business process modeling, audit flowchart, opportunity flowchart Business Processes

cross-functional flowchart, workflow, process chart, IDEF0, timeline, calendar, Gantt chart, business process modeling, audit flowchart, opportunity flowchart
Business Process solution extends ConceptDraw DIAGRAM software with business process diagrams as cross-functional flowcharts, workflows, process charts, IDEF0, timelines, calendars, Gantt charts, business process modeling, audit and opportunity flowcharts.

audit flowchart, fiscal flowchart, audit steps, chart audits, chart auditor, auditing process, audit process flowchart, audit planning process Audit Flowcharts

audit flowchart, fiscal flowchart, audit steps, chart audits, chart auditor, auditing process, audit process flowchart, audit planning process
Audit flowcharts solution extends ConceptDraw DIAGRAM software with templates, samples and library of vector stencils for drawing the audit and fiscal flow charts.

Steps of Accounting Cycle

The steps of accounting cycle include the processes of identifying, collecting, analyzing documents, recording transactions, classifying, summarizing, posting, and preparing trial balance, making journal entries, closing the books and final reporting financial information of an organization.
Use the ConceptDraw DIAGRAM with Accounting Flowcharts Solution to create your own professional Accounting Flowcharts of any complexity quick and easy.

Venn diagram, draw logical relations Venn Diagrams

Venn diagram, draw logical relations
Venn Diagrams are actively used to illustrate simple set relationships in set theory and probability theory, logic and statistics, mathematics and computer science, linguistics, sociology, and marketing. Venn Diagrams are also often used to visually summarize the status and future viability of a project.