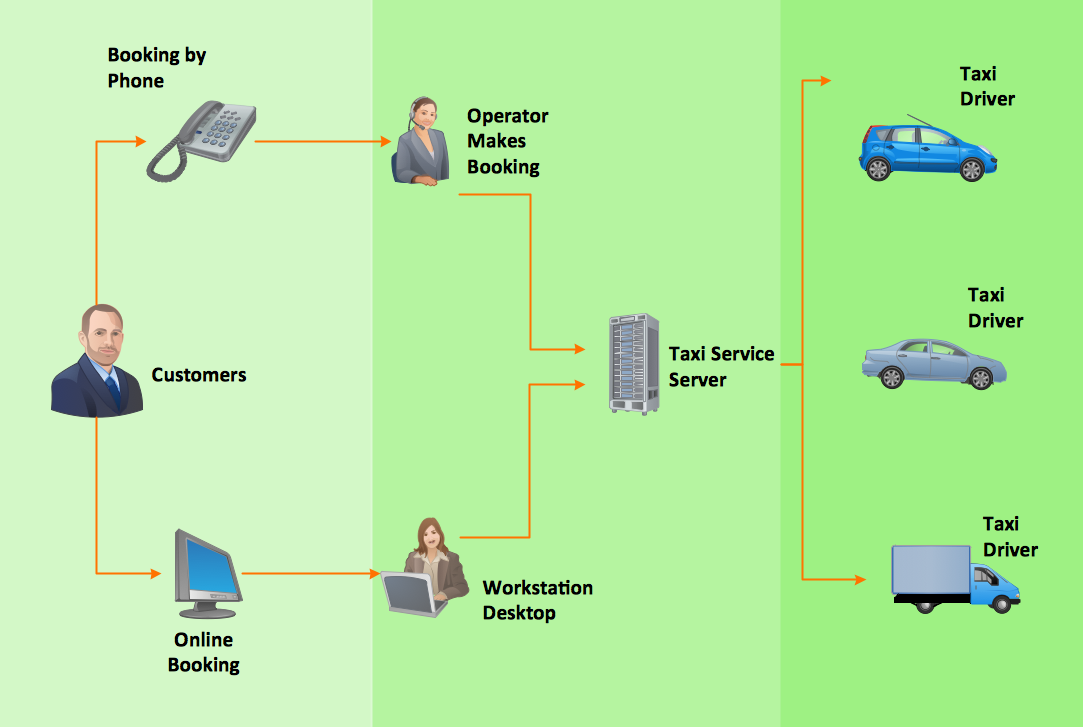
This example shows a presentation-ready workflow diagram that clearly illustrates how a taxi service works.
NINE RELATED HOW TO's:
UML Use Case Diagram Taxi Service - This sample was created in ConceptDraw DIAGRAM diagramming and vector drawing software using the UML Use Case Diagram library of the Rapid UML Solution from the Software Development area of ConceptDraw Solution Park.
This sample shows the work of the taxi service and is used by taxi stations, by airports, in the tourism field and delivery service.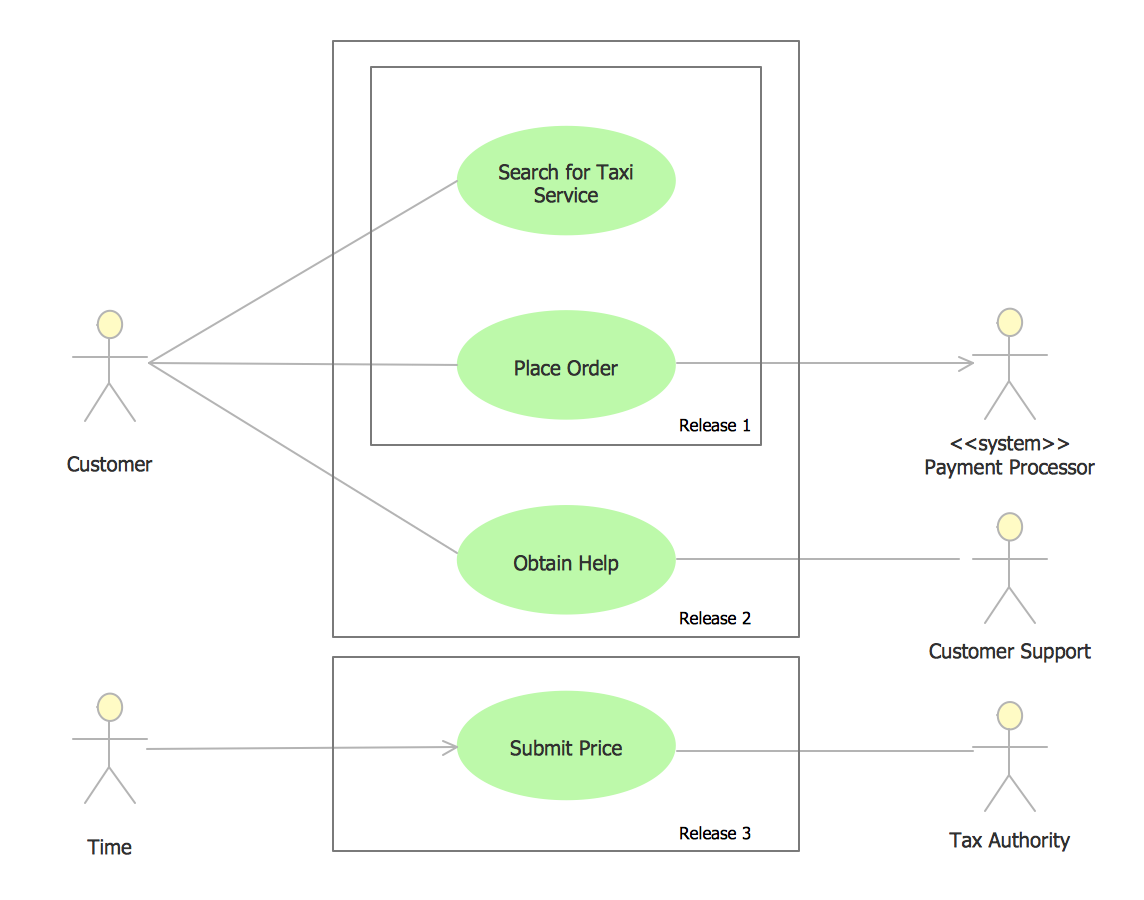
Picture: UML Use Case Diagram Example - Taxi Service
Related Solution:
Database design is an important part of any project, as databases become more and more complex nowadays. To make the model more representative, entity relationship diagrams are widely used in software engineering area. These diagrams show sets of entities as rectangles connected via lines labeled with their cardinalities.
This an example of the ER-diagram developed to store information regarding some online role-playing game. It includes three main elements of ER diagram: entities, relationships and attributes. The entities, attributes and relationships on this ER-diagram is depicted according to the Chen's notation. Chen's notation for Entity Relationship diagrams admits using of rectangles to depict entities, ovals for attributes and ,at least, diamonds to show relationships. ConceptDraw Entity-Relationship Diagrams solution was applied as ERD software to create this diagram.
Picture: ConceptDraw DIAGRAM ER Diagram Tool
Related Solution:
ConceptDraw is your tool for driving social integration and managing change across and streamline social media processes of your organisation.This tool keeps the entire team on the same page allowing you to realize your social media strategy, improve the quality of your answers, and minimize the time it takes to respond.
Picture: Social Media Response Management DFD Charts - software tools
Related Solution:
Flowcharts are used to represent accounting information in a system. In ConceptDraw software there are special symbols that are used to create accounting flowcharts.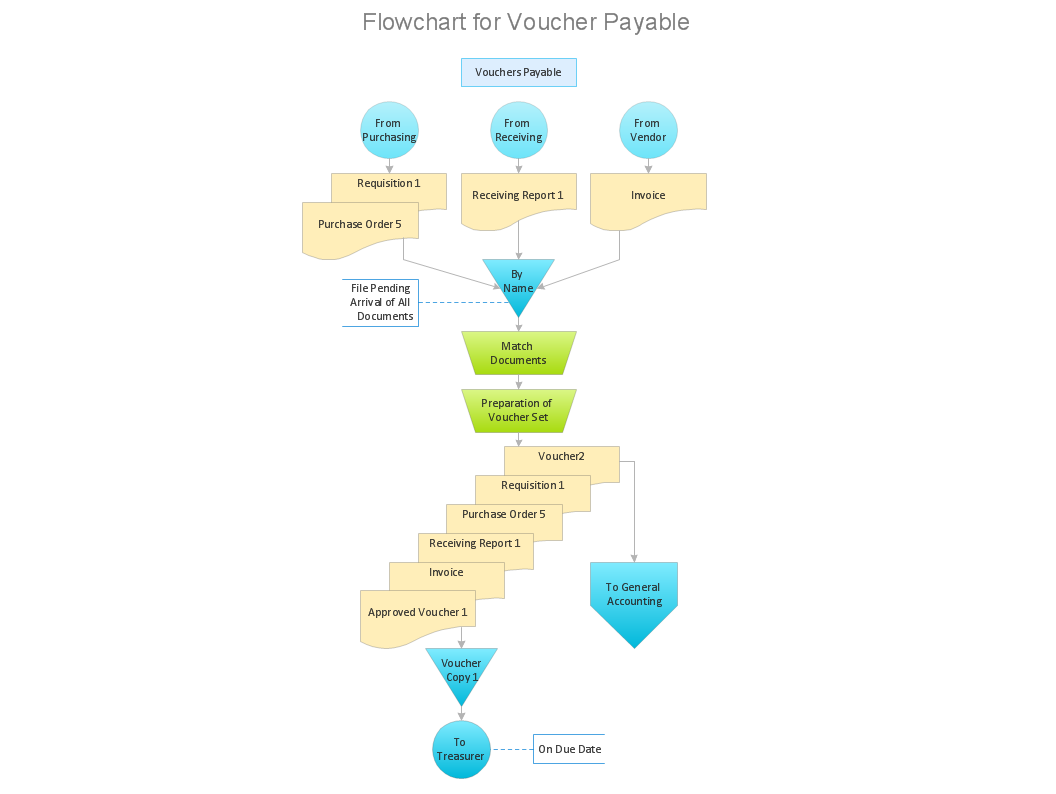
Picture: Why Flowchart is Important to Accounting Information System?
Related Solution:
ConceptDraw Value Stream Mapping solution extends software with templates, samples and vector shapes for drawing Value Stream Maps (VSM).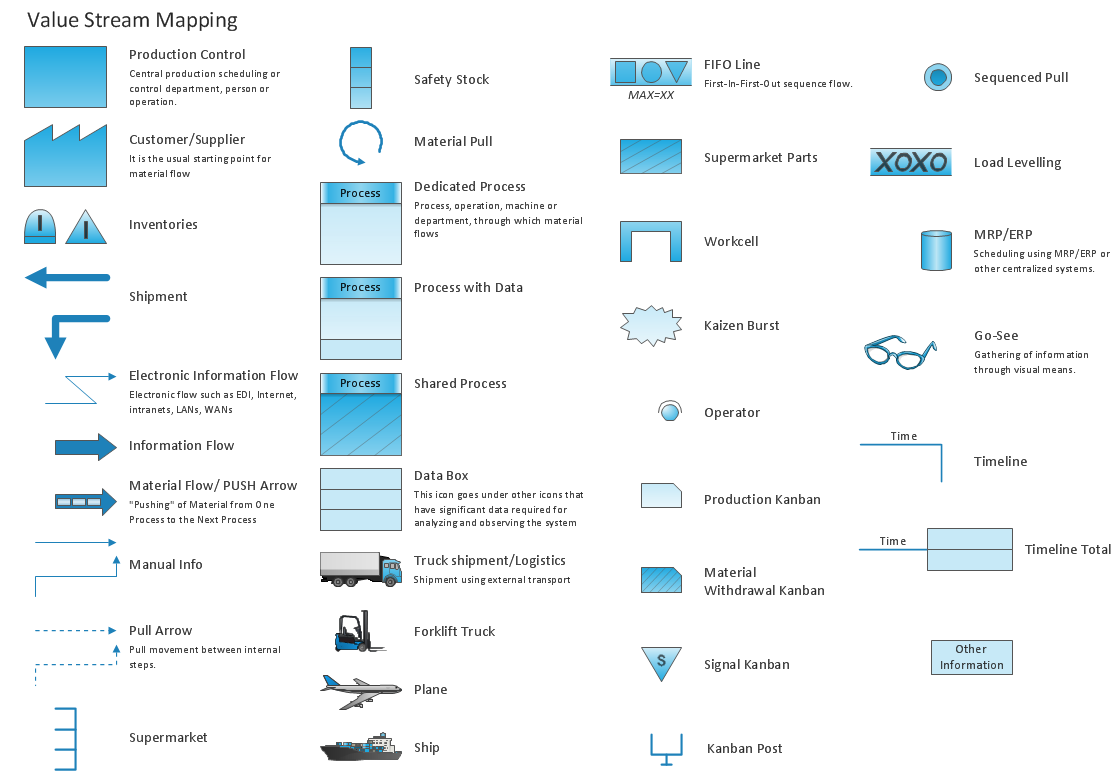
Picture: Standard Shapes for Value Stream Mapping
Related Solution:
ConceptDraw DIAGRAM is a world-class diagramming platform that lets you display, communicate, and present dynamically. It′s powerful enough to draw everything from basic flowcharts to complex engineering schematics.
Video tutorials on ConceptDraw products. Try it today!
Picture: Business Process Mapping — How to Map a Work Process
Related Solutions:
This sample shows the Use Case Diagram of parking lot control system. On this sample you can see use cases represented as ovals and three actors represented as figures of persons that employ these use cases. Associations between actors and use cases are shown as lines.
UML Diagram of Parking - This diagram can be used for understanding the process of working the car parking, at the projection and construction the parking by building companies and for automation the existing parkings.
Picture: UML Diagram of Parking
Related Solution:
Collaborative Project Management via Skype is an ideal tool for project teams who need to master a growing project complexity.
Picture: How To Implement Collaborative Project Management
Related Solution:
Perfect charts and graphics diagramming software with rich examples and template. ConceptDraw is ideal to draw Charts and Graphics.
Picture: Basic Diagramming
Related Solution: