 Event-driven Process Chain Diagrams
Event-driven Process Chain (EPC) Diagram is a type of flowchart widely used for modeling in business engineering and reengineering, business process improvement, and analysis. EPC method was developed within the Architecture of Integrated Information Systems (ARIS) framework.
Business Process Management
ConceptDraw RapidDraw technology is a simple point-and-click design that helps create professional, presentation-ready business process diagrams quickly and efficiently.HelpDesk
How to Draw a Chemical Process Flow Diagram
Process Flow Diagram widely used in modeling of processes in the chemical industry. A Chemical Process Flow diagram (PFD) is a specialized type of flowchart. With the help of Chemical Process Flow Diagram engineers can easily specify the general scheme of the processes and chemical plant equipment. Chemical Process Flow Diagram displays the real scheme of the chemical process, the relationship between the equipment and the technical characteristics of the process. Chemical Process Flow Diagram illustrates the connections between the basic equipment as well as the overall structure of pipelines and other supporting equipment. The purpose of the PFD is to build the image of the basic idea of the chemical process. ConceptDraw PRO together with its Chemical and Process Engineering solution delivers the possibility to design Chemical Process Flow diagrams. It is designed for chemical industry engineers and designers.
 ConceptDraw Solution Park
ConceptDraw Solution Park collects graphic extensions, examples and learning materials
HelpDesk
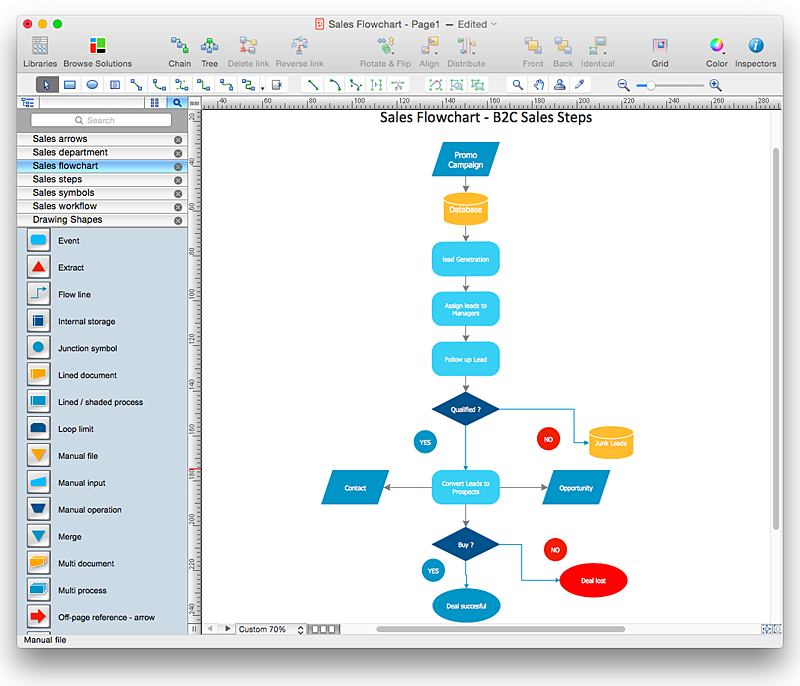
How to Create a Sales Flowchart Using ConceptDraw PRO
A Sales flowchart is a specialized type of flowchart. With the help of a sales flowchart you can visually describe tasks, documents, people responsible for execution at each stage of the sales process. For most commercial organizations, the sales process is inherent to its existence and ability to create profit. Although each company will achieve this aim in its own way, the core selling process remains similar throughout — a potential buyer or prospective customer exchanges money with an organization in return for goods or services. Despite this rather simplistic definition, there exists huge scope as to which approach is taken. Indeed, it is not uncommon for the sales division to be the largest within a corporate structure, employing a team of salespeople, analysts, and the sales managers, who are in charge of sales division operations.The practical applications of sales process flowcharts are numerous and wide ranging. At sales level, you might map the process of customer interact
 Block Diagrams
Block diagrams solution extends ConceptDraw PRO software with templates, samples and libraries of vector stencils for drawing the block diagrams.
HelpDesk
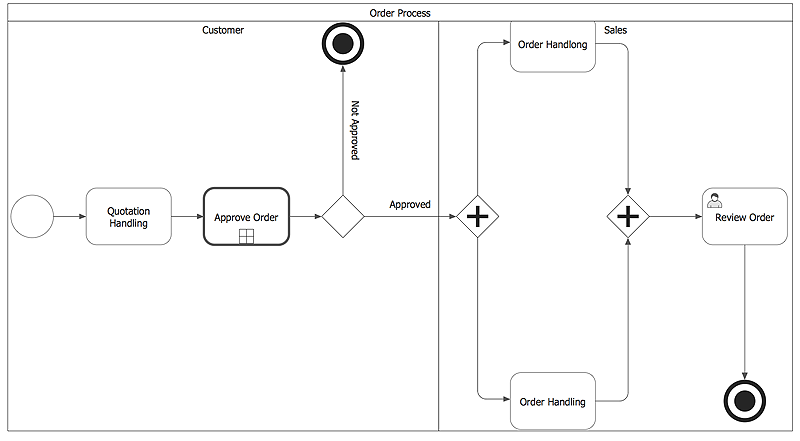
How to Create a Business Process Diagram
Making a Business Process diagram involves many different elements that can be managed using ConceptDraw PRO. The ability to design Business Process diagrams is delivered by the Business Process Diagrams solution.- Sales Process Flowchart. Flowchart Examples | Sales Process Steps ...
- Block diagram - Selling technology patent process | Sales Process ...
- Sales Process Flowchart. Flowchart Examples | Block diagram ...
- | Sales Process Flowchart. Flowchart Examples | | Selling
- Entity-Relationship Diagram (ERD) | Sales Process Flowchart ...
- Sales Process Flowchart. Flowchart Examples | Relations diagram ...
- Sales Process Flowchart. Flowchart Examples | Event-driven ...
- | | Sales Process Flowchart. Flowchart Examples | Diagram Sale
- Draw The Selling Process Diagram
- Sales Process Flowchart. Flowchart Examples | | Work Order ...
- Sales Process Example Diagram
- Sales Process Flowchart. Flowchart Examples | | Marketing and ...
- Circular Arrows Diagrams | Sales Process Flowchart. Flowchart ...
- Flowchart Marketing Process. Flowchart Examples | Sales Process ...
- Sales Process Flow Diagram
- Block Diagram Of Industial Selling Process
- Sales Process Flowchart. Flowchart Examples | Process Flowchart ...
- Business Sales Process Diagram
- Sales Process Flowchart. Flowchart Examples | UML composite ...


