 Event-driven Process Chain Diagrams
Event-driven Process Chain (EPC) Diagram is a type of flowchart widely used for modeling in business engineering and reengineering, business process improvement, and analysis. EPC method was developed within the Architecture of Integrated Information Systems (ARIS) framework.
Process Flowchart


Basic Flowchart Symbols and Meaning


Types of Flowcharts


Pyramid Diagram

Pyramid Diagram

 Total Quality Management TQM Diagrams
Total Quality Management Diagrams solution extends ConceptDraw PRO software with samples, templates and vector stencils library for drawing the TQM flowcharts.
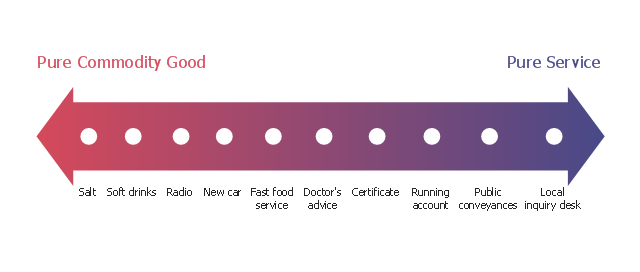
This marketing diagram sample depicts service-goods continuum.
"The dichotomy between physical goods and intangible services is an oversimplification; these are not discrete categories. Most business theorists see a continuum with pure service at one endpoint and pure commodity goods at the other endpoint. Most products fall between these two extremes. Goods are normally structural and can be transferred in an instant while services are delivered over a period of time. Goods can be returned while a service once delivered cannot. Goods are not always tangible and may be virtual." [Goods and services. Wikipedia]
The marketing chart example "Service-goods continuum diagram" was created using the ConceptDraw PRO diagramming and vector drawing software extended with the Marketing Diagrams solution from the Marketing area of ConceptDraw Solution Park.
Marketing chart
 Basic Diagramming
This solution extends ConceptDraw PRO software with the specific tools you need to easily draw flowcharts, block diagrams, histograms, pie charts, divided bar diagrams, line graphs, circular arrows diagrams, Venn diagrams, bubble diagrams and concept maps
 Cross-Functional Flowcharts
Cross-functional flowcharts are powerful and useful tool for visualizing and analyzing complex business processes which requires involvement of multiple people, teams or even departments. They let clearly represent a sequence of the process steps, the order of operations, relationships between processes and responsible functional units (such as departments or positions).
HelpDesk
How to Create a Timeline Diagram in ConceptDraw PRO

- Marketing Diagrams
- Marketing Diagrams | Flowchart Marketing Process. Flowchart ...
- Marketing Diagrams | Marketing Analysis Diagram | Marketing mix ...
- Flowchart Marketing Process. Flowchart Examples | Sales Process ...
- The Circular Flow Diagram | Circular Arrows Diagrams | Basic ...
- Customer Marketing Diagram
- Concept Of Product Market With Diagram
- Circular Diagram | Process Flowchart | Basic Flowchart Symbols and ...
- Marketing Diagrams | Marketing Charts | Marketing Organization ...
- Matrices | Ansoff's product / market matrix | SWOT matrix template ...
- Marketing Flow Chart | Marketing Organization Chart | Flowchart ...
- 5 level pyramid model diagram of information systems types ...
- Venn diagram - Relationship marketing | Block diagram - Six ...
- Information Flow Diagram In A Marketing Departments
- Circular Arrows Diagrams | The Circular Flow Diagram | Basic ...
- Marketing mix - Wheel diagram | Marketing mix diagram | Target ...
- Leaky bucket diagram | Marketing diagrams - Vector stencils library ...
- Feature Comparison Chart Software | Market Chart | Deployment ...
- Design elements - Marketing charts | Marketing Analysis Diagram ...
- Explain Marketing Process Using Diagram And Examples