HelpDesk
Event-driven Process Chain (EPC) Diagram Software

This wheel diagram sample was created on the base of figure illustrating the webpage "Chapter 3: Current State of the Ecosystem" of the website of the National Broadband Plan of US Federal Communications Comission (FCC). "The broadband ecosystem includes applications and content: e-mail, search, news, maps, sales and marketing applications used by businesses, user-generated video and hundreds of thousands of more specialized uses. Ultimately, the value of broadband is realized when it delivers useful applications and content to end-users.
Applications run on devices that attach to the network and allow users to communicate: computers, smartphones, set-top boxes, e-book readers, sensors, private branch exchanges (PBX), local area network routers, modems and an ever-growing list of other devices. New devices mean new opportunities for applications and content.
Finally, broadband networks can take multiple forms: wired or wireless, fixed or mobile, terrestrial or satellite. Different types of networks have different capabilities, benefits and costs.
The value of being connected to the network increases as more people and businesses choose to adopt broadband and use applications and devices that the network supports. Several factors contribute to their decisions. These include whether they can afford a connection, whether they are comfortable with digital technology and whether they believe broadband is useful.
Networks, devices and applications drive each other in a virtuous cycle. If networks are fast, reliable and widely available, companies produce more powerful, more capable devices to connect to those networks. These devices, in turn, encourage innovators and entrepreneurs to develop exciting applications and content. These new applications draw interest among end-users, bring new users online and increase use among those who already subscribe to broadband services. This growth in the broadband ecosystem reinforces the cycle, encouraging service providers to boost the speed, functionality and reach of their networks."
[broadband.gov/ plan/ 3-current-state-of-the-ecosystem/ ]
The circle pie chart example "Forces shaping the broadband ecosystem in the US" was created using the ConceptDraw PRO diagramming and vector drawing software extended with the Target and Circular Diagrams solution from the Marketing area of ConceptDraw Solution Park.
www.conceptdraw.com/ solution-park/ marketing-target-and-circular-diagrams
Wheel diagram

Process Flowchart


Relative Circular Diagram

 Entity-Relationship Diagram (ERD)
Entity-Relationship Diagram (ERD) solution extends ConceptDraw PRO software with templates, samples and libraries of vector stencils from drawing the ER-diagrams by Chen's and crow’s foot notations.
Venn Diagram

HelpDesk
How to Make a Workflow Diagram Using ConceptDraw PRO

Deployment Chart Software

Relative Value Chart Software

Authority Matrix Diagram Software

 eLearning for Skype
This solution extends ConceptDraw MINDMAP software with the ability to prepare and run remote learning sessions by using Skype
 Sales Flowcharts
The Sales Flowcharts solution lets you create and display sales process maps, sales process workflows, sales steps, the sales process, and anything else involving sales process management.
Growth-Share Matrix Software

Types of Flowcharts


Sales Process Flowcharts

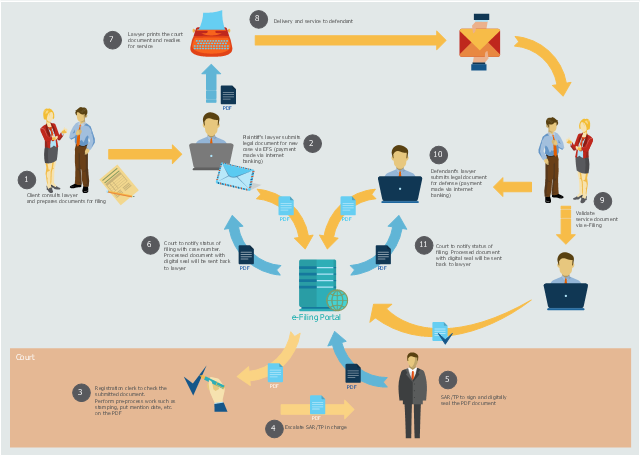
This workflow diagram example was created on the base of picture "Online submission" from the e-Filing Portal of the Malaysian Judiciary. [efiling.kehakiman.gov.my/ eFiling/ img/ efiling_ general_ workflow.jpg]
"The e-Filing Portal is an initiative of the Malaysian Judiciary and has been designed to serve as a one-stop portal for the legal community to gain access to all its needs ranging from registration of cases, filing of case documents, retrieval of service document right down to searching of case files and information including case schedules.
Previously lawyers have to call the registrar for the status of their case filing. Now the e-Filing portal will send notification of any case filing status to the lawyers' email immediately upon successful registration in the e-Filing System." [efiling.kehakiman.gov.my/ eFiling]
The flowchart example "E-Filing general workflow" was created using the ConceptDraw PRO diagramming and vector drawing software extended with the Sales Flowcharts solution from the Marketing area of ConceptDraw Solution Park.
Workflow diagram
 Metro Map
Metro Map solution extends ConceptDraw PRO software with templates, samples and library of vector stencils for drawing the metro maps, route maps, bus and other transport schemes, or design tube-style infographics.
 ConceptDraw Solution Park
ConceptDraw Solution Park collects graphic extensions, examples and learning materials
 Audio and Video Connectors
Audio and video connectors solution extends ConceptDraw PRO software with templates, samples and library of vector stencils for drawing audio and video hook up diagrams.
- Photo For E Marketing Diagrams
- Marketing Diagrams | Marketing | Marketing and Sales Organization ...
- Er Diagram Of E Marketing
- Marketing Flow Chart | Marketing Organization Chart | Flowchart ...
- UML Component Diagram Example - Online Shopping | Example of ...
- Entity-Relationship Diagram (ERD) | Process Flowchart ...
- Process Flowchart | How to Create an Electrical Diagram Using ...
- Entity-Relationship Diagram (ERD) | How to Create an ERD ...
- Feature Comparison Chart Software | Market Chart | Deployment ...
- Entity-Relationship Diagram (ERD) | Marketing | Fishbone Diagram ...
- E -Filing general workflow | Sales Process Flowcharts | Online store ...
- Erd Diagram On E Learning
- Marketing mix - Wheel diagram | Marketing mix diagram | Target ...
- Flowchart Marketing Process. Flowchart Examples | Sales Process ...
- E -mail history - infographics | Gant Chart in Project Management ...
- Target Diagram | Marketing | Daily Schedule Chart | The Chart Of ...
- Content marketing cycle - Diamond pie chart | Design elements ...
- Circle-Spoke Diagrams
- Circle-spoke diagram template - Target market | Pie Chart Examples