Process Flowchart


This flow chart sample was drawn on the base on the illustration of the article "Climate change impact on China food security in 2050" from the website of Chinese Academy of Agricultural Sciences .
[caas.cn/ en/ newsroom/ research_ update/ 67347.shtml]
"Food security is a condition related to the ongoing availability of food. ...
According to the Food and Agriculture Organization (FAO), food security "exists when all people, at all times, have physical and economic access to sufficient, safe and nutritious food to meet their dietary needs and food preferences for an active and healthy life". ...
Extreme events, such as droughts and floods, are forecast to increase as climate change takes hold. Ranging from overnight floods to gradually worsening droughts, these will have a range of impacts on the agricultural sector. ...
According to the Climate & Development Knowledge Network report Managing Climate Extremes and Disasters in the Agriculture Sectors: Lessons from the IPCC SREX Report, the impacts will include changing productivity and livelihood patterns, economic losses, and impacts on infrastructure, markets and food security. Food security in future will be linked to our ability to adapt agricultural systems to extreme events." [Food security. Wikipedia]
The flowchart example "Food security assessment" was created using the ConceptDraw PRO diagramming and vector drawing software extended with the Flowcharts solution from the area "What is a Diagram" of ConceptDraw Solution Park.
Flowchart

This step chart sample shows engineering value chain. It was designed on the base of the Wikimedia Commons file: The engineering value chain.png. "The engineering value chain (EVC) refers to a series of engineering activities and capabilities contributing to value creation encompassing essential elements such as idea generation & selection, design & development, production & delivery, service & support, and disposal & recycling for example." [commons.wikimedia.org/ wiki/ File:The_ engineering_ value_ chain.png]
This file is licensed under the Creative Commons Attribution-Share Alike 3.0 Unported license. [creativecommons.org/ licenses/ by-sa/ 3.0/ deed.en]
The diagram example "Step chart - Value chain" was created using the ConceptDraw PRO diagramming and vector drawing software extended with the Marketing Diagrams solution from the Marketing area of ConceptDraw Solution Park.
Marketing diagram

Bar Diagrams for Problem Solving. Create manufacturing and economics bar charts with Bar Graphs Solution

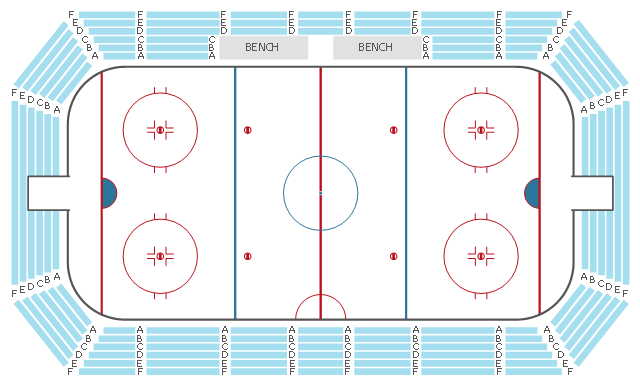
This seating plan sample shows the stadium seat layout.
"A modern stadium (plural stadiums/ stadia) is a place or venue for (mostly) outdoor sports, concerts, or other events and consists of a field or stage either partly or completely surrounded by a structure designed to allow spectators to stand or sit and view the event. ...
Spectator areas and seating.
An "all-seater" stadium has seats for all spectators. Other stadiums are designed so that all or some spectators stand to view the event. The term "all-seater" is not common in the U.S., perhaps because very few American stadiums have sizeable standing-only sections. ...
The spectator areas of a stadium may be referred to as bleachers, especially in the U.S., or as terraces, especially in the United Kingdom, but also in some American baseball parks, as an alternative to the term tier. Originally set out for standing room only, they are now usually equipped with seating. Either way, the term originates from the step-like rows which resemble agricultural terraces. Related, but not precisely the same, is the use of the word terrace to describe a sloping portion of the outfield in a baseball park, possibly, but not necessarily for seating, but for practical or decorative purposes. ... Many stadiums make luxury suites or boxes available to patrons at high prices. These suites can accommodate fewer than 10 spectators or upwards of 30 depending on the venue. Luxury suites at events such as the Super Bowl can cost hundreds of thousands of dollars." [Stadium. Wikipedia]
The seat layout example "Stadium seating plan" was created using the ConceptDraw PRO diagramming and vector drawing software extended with the Seating Plans solution from the Building Plans area of ConceptDraw Solution Park.
Seat layout
Bar Diagrams for Problem Solving. Create economics and financial bar charts with Bar Graphs Solution

Geo Map — USA — Virginia

Bar Diagrams for Problem Solving. Create business management bar charts with Bar Graphs Solution

The Best Drawing Program for Mac

Sample Pictorial Chart. Sample Infographics
")
Workflow Flowchart Symbols

Scatter Graph Charting Software

Matrix Organization

- Diagram For Agriculture Sector
- Flow Diagram In Informative Agricultural Sector
- Agriculture Sector With Diagram
- Agriculture Sector Digram
- Diagram Steps Of Agriculture Practices
- Sector diagram - Template | Economic sector weightings | New ...
- Agriculture Sector Diagram S
- Flow çhart About Agricultural Sector
- Area Charts | Bar Diagram Of Planning In Agriculture In India
- Europe browser usage share | Piechart Related To Agricultural Crops
- Economic sector weightings | Bar Diagrams for Problem Solving ...
- Data Flow Diagram Of Agriculture Website
- Steps A Agriculture Practice Diagram
- Example of DFD for Online Store (Data Flow Diagram ) DFD ...
- Opportunities in agro and food processing sector in Punjab | Punjab ...
- Flow Chart On Agriculture
- Flow chart Example. Warehouse Flowchart | Process Engineering ...
- Agriculture Marketing Diagrams
- Sector diagram - Template | Lean Six Sigma Diagram Software | Bar ...