PROBLEM ANALYSIS. Root Cause Analysis Tree Diagram

ConceptDraw Office suite is a software for problem analysis.

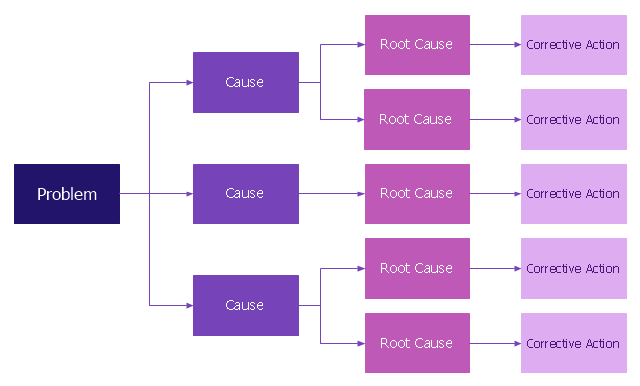
Root cause analysis (RCA) tree diagram lets identify the root causes for a factor and then list possible corrective action. The diagram displays the structure of causes for a factor and possible corrective actions. The root cause analysis tree diagram is used for further formulation of actions.
"Tree Diagram.
This tool is used to break down broad categories into finer and finer levels of detail. It can map levels of details of tasks that are required to accomplish a goal or solution or task. Developing the tree diagram helps one move their thinking from generalities to specifics." [Seven Management and Planning Tools. Wikipedia]
This root cause analysis tree diagram template for the ConceptDraw PRO diagramming and vector drawing software is included in the Seven Management and Planning Tools solution from the Management area of ConceptDraw Solution Park.
RCA diagram
HelpDesk
How To Create Root Cause Analysis Diagram Using ConceptDraw Office

Root Cause Analysis

Analyze the root causes for factors that influenced the problem. This diagram is constructed separately for each highly prioritized factor. The goal of this is to find the root causes for the factor and list possible corrective action.
"Root cause analysis (RCA) is a method of problem solving that tries to identify the root causes of faults or problems.
RCA practice tries to solve problems by attempting to identify and correct the root causes of events, as opposed to simply addressing their symptoms. Focusing correction on root causes has the goal of preventing problem recurrence. RCFA (Root Cause Failure Analysis) recognizes that complete prevention of recurrence by one corrective action is not always possible.
Conversely, there may be several effective measures (methods) that address the root causes of a problem. Thus, RCA is an iterative process and a tool of continuous improvement.
RCA is typically used as a reactive method of identifying event(s) causes, revealing problems and solving them. Analysis is done after an event has occurred. Insights in RCA may make it useful as a preemptive method. In that event, RCA can be used to forecast or predict probable events even before they occur. While one follows the other, RCA is a completely separate process to Incident Management." [Root cause analysis. Wikipedia]
The root cause analysis (RCA) tree diagram example "Manufacturing problem solution" was created using the ConceptDraw PRO diagramming and vector drawing software extended with the solution "Seven Management and Planning Tools" from the Management area of ConceptDraw Solution Park.
Tree diagram

"A root cause is an initiating cause of a causal chain which leads to an outcome or effect of interest. Commonly, root cause is used to describe the depth in the causal chain where an intervention could reasonably be implemented to change performance and prevent an undesirable outcome." [Root cause. Wikipedia]
"Problem-solving consists of using generic or ad hoc methods, in an orderly manner, for finding solutions to problems. Some of the problem-solving techniques developed and used in artificial intelligence, computer science, engineering, mathematics, medicine, etc. are related to mental problem-solving techniques studied in psychology." [Problem solving. Wikipedia]
This root cause analysis (RCA) tree diagram example "Personal problem solution" was created using the ConceptDraw PRO diagramming and vector drawing software extended with the Seven Management and Planning Tools solution from the Management area of ConceptDraw Solution Park.
Tree diagram

"Root cause analysis (RCA) is a method of problem solving that tries to identify the root causes of faults or problems. ...
RCA (in steps 3, 4 and 5) forms the most critical part of successful corrective action, because it directs the corrective action at the true root cause of the problem. Knowing the root cause is secondary to the goal of prevention, but without knowing the root cause, it is not possible to determine what an effective corrective action for the defined problem would be. ...
3. Ask "why" and identify the causes associated with each step in the sequence towards the defined problem or event. "Why" is taken to mean "What were the factors that directly resulted in the effect?"
4. Classify causes into causal factors that relate to an event in the sequence and root causes, that if eliminated, can be agreed to have interrupted that step of the sequence chain.
5. Identify all other harmful factors that have equal or better claim to be called "root causes." If there are multiple root causes, which is often the case, reveal those clearly for later optimum selection." [Root cause analysis. Wikipedia]
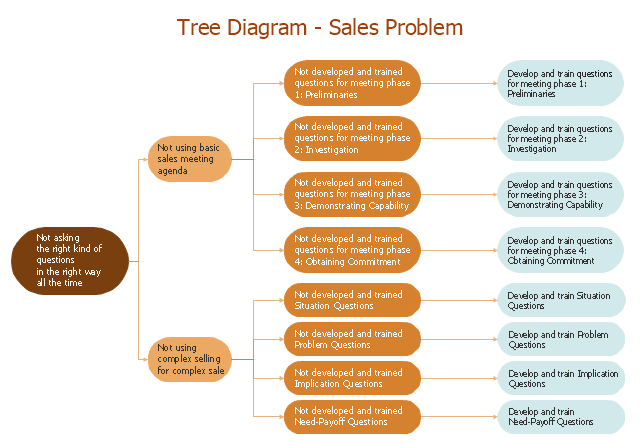
This root cause analysis (RCA) tree diagram example "Sale problem solution" was created using the ConceptDraw PRO diagramming and vector drawing software extended with the Seven Management and Planning Tools solution from the Management area of ConceptDraw Solution Park.
RCA (in steps 3, 4 and 5) forms the most critical part of successful corrective action, because it directs the corrective action at the true root cause of the problem. Knowing the root cause is secondary to the goal of prevention, but without knowing the root cause, it is not possible to determine what an effective corrective action for the defined problem would be. ...
3. Ask "why" and identify the causes associated with each step in the sequence towards the defined problem or event. "Why" is taken to mean "What were the factors that directly resulted in the effect?"
4. Classify causes into causal factors that relate to an event in the sequence and root causes, that if eliminated, can be agreed to have interrupted that step of the sequence chain.
5. Identify all other harmful factors that have equal or better claim to be called "root causes." If there are multiple root causes, which is often the case, reveal those clearly for later optimum selection." [Root cause analysis. Wikipedia]
This root cause analysis (RCA) tree diagram example "Sale problem solution" was created using the ConceptDraw PRO diagramming and vector drawing software extended with the Seven Management and Planning Tools solution from the Management area of ConceptDraw Solution Park.
RCA diagram
Cause and Effect Analysis

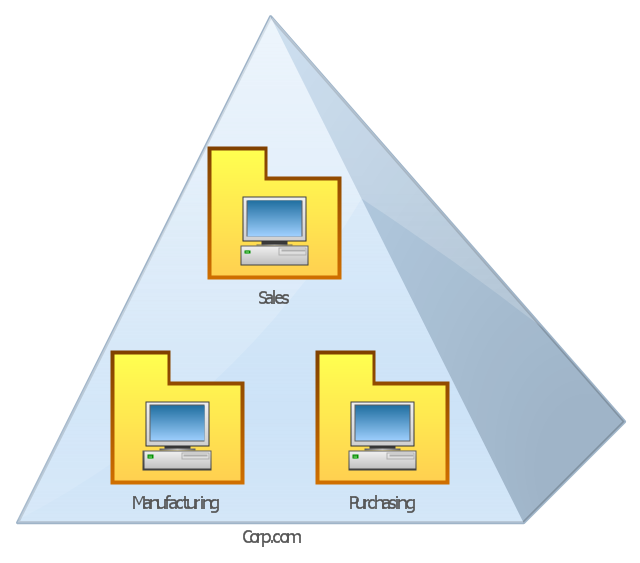
This AD diagram example was redesigned from the picture "Single root domain with a structured OU model" from the book "Active Directory for Dummies".
"A domain is the cornerstone that you lay whenever you create trees and forests. Regardless of whether you design a tree or a forest, the starting point is always the root domain. The root domain is the first domain that you create in your AD structure, and it sits at the top of your diagram.
The root domain of your tree, similar to any other domain, is a grouping of
resources built on the following components:
(1) Domain controllers.
(2) Security policies. ...
For many small and medium-sized companies, a single root domain with a
structured OU (organizational unit) model... provides sufficient flexibility for an AD tree. ...
However, larger companies, companies with complex organization charts, and
companies with multiple sites often find that a single domain isn’t suitable." [Steve Clines and Marcia Loughry, Active Directory® For Dummies®, 2nd Edition. 2008]
The Active Directory diagram example "Single root domain with a structured OU model" was created using the ConceptDraw PRO diagramming and vector drawing software extended with the Active Directory Diagrams solution from the Computer and Networks area of ConceptDraw Solution Park.
Active Directory network diagram
Decision Making

The Seven Management and Planning Tools is a set for such diagrams: Affinity Diagram, Relations Diagram, Prioritization Matrix, Root Cause Tree Diagram, Involvement Matrix, PERT Chart, Risk Diagram (PDPC).
 Seven Management and Planning Tools
Seven Management and Planning Tools solution extends ConceptDraw PRO and ConceptDraw MINDMAP with features, templates, samples and libraries of vector stencils for drawing management mind maps and diagrams.
Activity Network Diagram Method

This sample shows the PERT (Program Evaluation Review Technique) chart of the request on proposal. A request for proposal (RFP) is a request of the company or the organization to potential suppliers to submit the business proposals for service or goods that it is interested to purchase. The RFP is represented on the initial procurement stage and allows to define the risks and benefits.
Problem solving

These tools are exemplary at organizing research, parsing complex problems, providing a structure for the details, helping managers make decisions, and organizing effective communications in a visual manner that keeps everyone involved.
 Seven Management and Planning Tools
Seven Management and Planning Tools solution extends ConceptDraw PRO and ConceptDraw MINDMAP with features, templates, samples and libraries of vector stencils for drawing management mind maps and diagrams.
The Action Plan

ConceptDraw Office suite is a software for decision making and action plan.
Affinity Diagram

CORRECTIVE ACTIONS PLANNING. Risk Diagram (PDPC)
 - Health care")
PROBLEM ANALYSIS. Identify and Structure Factors

ConceptDraw Office suite is a software for identify and structure factors with affinity diagram. This is a grouping and structuring of factors that impact on a problem.
CORRECTIVE ACTIONS PLANNING. PERT Chart

ConceptDraw Office suite is a software for corrective actions planning.
PROBLEM ANALYSIS. Relations Diagram

ConceptDraw Office suite is a software for relation diagram making.
- Root cause analysis tree diagram
- Cause and Effect Analysis (Fishbone Diagrams ) | PROBLEM ...
- Lean Manufacturing Diagrams | Root cause analysis tree diagram ...
- PROBLEM ANALYSIS Root Cause Analysis Tree Diagram | Root ...
- Root cause analysis tree diagram template | Fault Tree Diagram ...
- PROBLEM ANALYSIS Prioritization Matrix | PROBLEM ANALYSIS ...
- PROBLEM ANALYSIS Root Cause Analysis Tree Diagram ...
- Root cause analysis tree diagram - Manufacturing problem solution ...
- Root cause analysis tree diagram - Sale problem solution | Seven ...
- Root Cause Analysis | Decision Making | PROBLEM ANALYSIS ...
- Risk Analysis | CORRECTIVE ACTIONS PLANNING Risk Diagram ...
- UML composite structure diagram - Sale process | Root cause ...
- Fault Tree Analysis Diagrams | Root cause analysis tree diagram ...
- Root cause analysis tree diagram template
- Cause and Effect Analysis (Fishbone Diagrams ) | Cause & Effect ...
- Cause and Effect Analysis (Fishbone Diagrams ) | PROBLEM ...
- PROBLEM ANALYSIS Root Cause Analysis Tree Diagram | Total ...
- Root cause analysis tree diagram - Manufacturing problem solution ...
- PROBLEM ANALYSIS. Root Cause Analysis Tree Diagram | Using ...
- Root cause analysis tree diagram - Personal problem solution ...