 Event-driven Process Chain Diagrams
Event-Driven Process Chain Diagrams solution extends ConceptDraw DIAGRAM functionality with event driven process chain templates, samples of EPC engineering and modeling the business processes, and a vector shape library for drawing the EPC diagrams and EPC flowcharts of any complexity. It is one of EPC IT solutions that assist the marketing experts, business specialists, engineers, educators and researchers in resources planning and improving the business processes using the EPC flowchart or EPC diagram. Use the EPC solutions tools to construct the chain of events and functions, to illustrate the structure of a business process control flow, to describe people and tasks for execution the business processes, to identify the inefficient businesses processes and measures required to make them efficient.
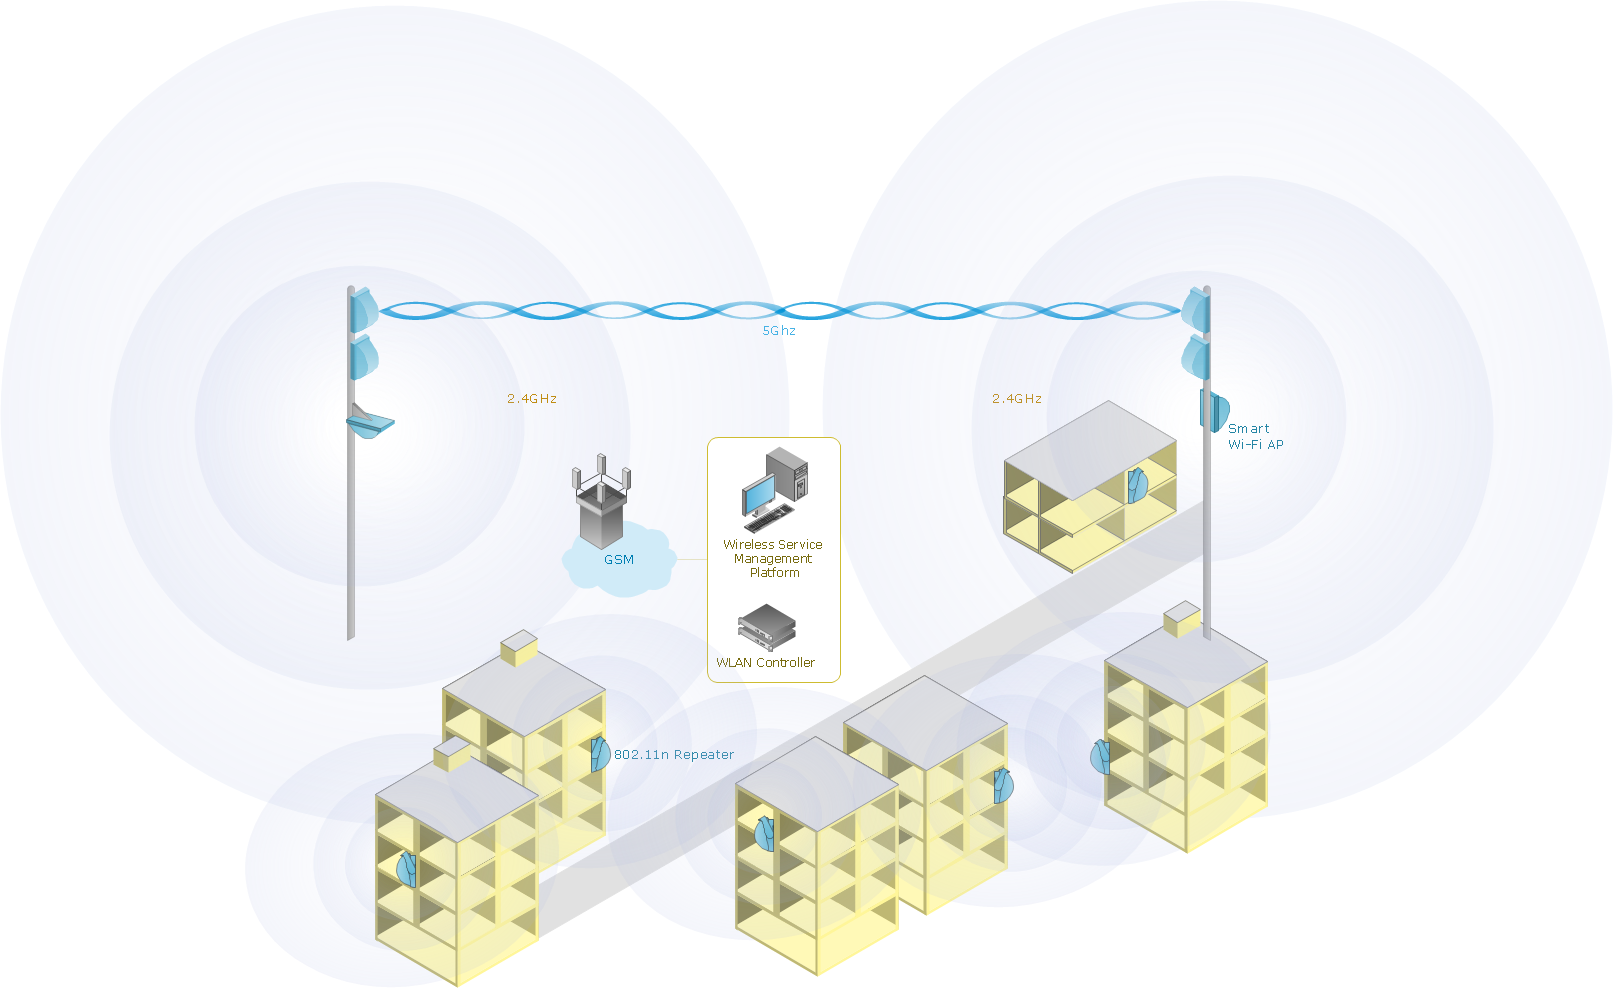
Calculate the cost of creating or updating a wireless computer network
 Seven Management and Planning Tools
Seven Management and Planning Tools solution extends ConceptDraw DIAGRAM and ConceptDraw MINDMAP with features, templates, samples and libraries of vector stencils for drawing management mind maps and diagrams.
Wireless Network Diagram Examples
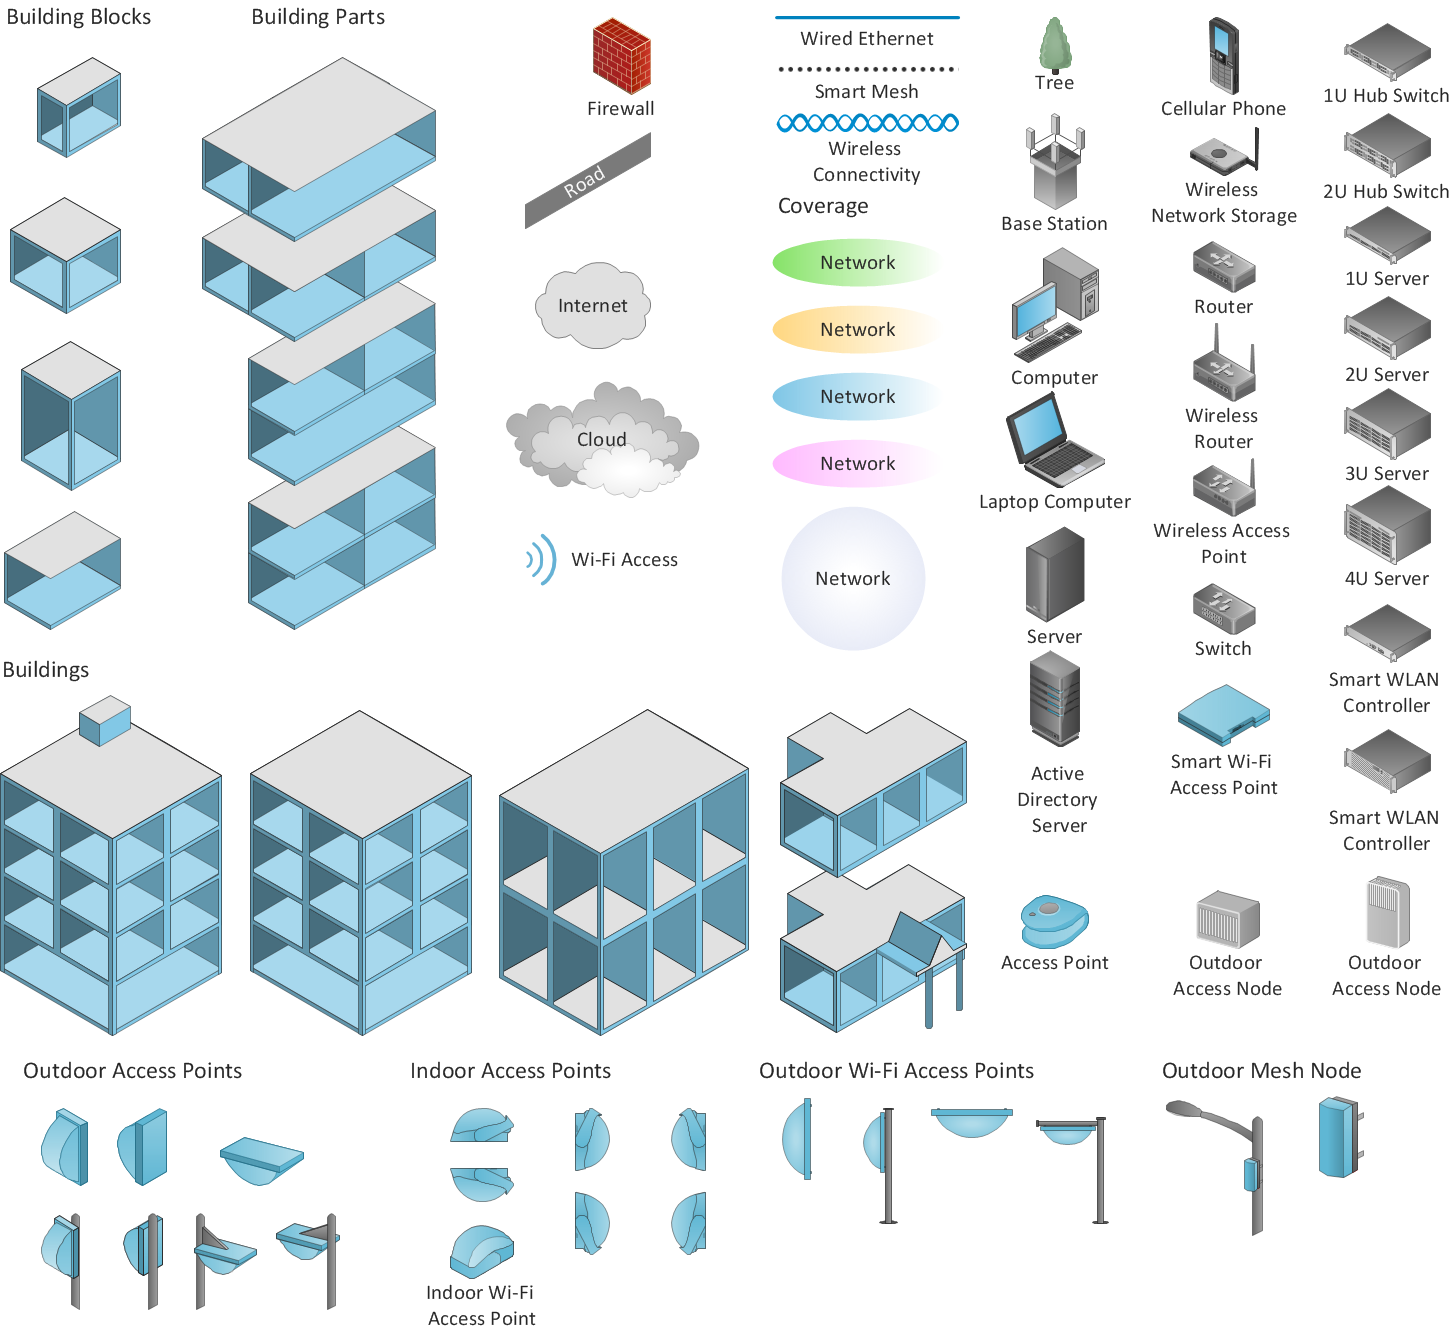
 Computer and Networks Area
The solutions from Computer and Networks Area of ConceptDraw Solution Park collect samples, templates and vector stencils libraries for drawing computer and network diagrams, schemes and technical drawings.
 Cross-Functional Flowcharts
Cross-functional flowcharts are powerful and useful tool for visualizing and analyzing complex business processes which requires involvement of multiple people, teams or even departments. They let clearly represent a sequence of the process steps, the order of operations, relationships between processes and responsible functional units (such as departments or positions).
 Vehicular Networking
The Vehicular Networking solution extends the ConceptDraw DIAGRAM software functionality with specialized tools, wide variety of pre-made vector objects, collection of samples and templates in order to help network engineers design vehicular network diagrams for effective network engineering activity, visualize vehicular networks, develop smart transportation systems, design various types of vehicle network management diagrams, regional network diagrams, vehicular communication system diagrams, vehicular ad-hoc networks, vehicular delay-tolerant networks, and other network engineering schemes.
 Time Series Dashboard
Time series dashboard solution extends ConceptDraw DIAGRAM software with templates, samples and vector stencils libraries with charts, graphs and plots for drawing the visual dashboards showing data time series.
UML Diagram

 Business Productivity Area
Business Productivity Solutions extend ConceptDraw products with tools for making presentations, conducting meetings, preparing documents, brainstorming, or building new strategies.
- EPC diagram - Order processing | Computer and Networks Area |
- Venn Diagram Examples for Problem Solving. Computer Science ...
- Cross-Functional Flowcharts | Opportunity flowchart - Order ...
- How to Draw a Computer Network Diagrams ... - Conceptdraw.com
- Process Flowchart | Business Process Diagram | Event-driven ...
- Network Diagram Software ISG Network Diagram | Applications ...
- Computer and Networks Software | ConceptDraw.com
- Fishbone Diagram | Manufacturing and Maintenance | Value Stream ...
- Porter's value chain matrix diagram | Computers and ...
- UML Collaboration Diagram (UML2.0) | Design Elements for AWS ...
- Process Flowchart | Workflow Process Example | BPMN 1.2 diagram ...
- Fishbone Diagram | How to Draw a Computer Network Diagrams ...
- Definition TQM Diagram | Total Quality Management Definition ...
- Conceptdraw.com: Mind Map Software, Drawing Tools | Project ...
- Bubble diagrams with ConceptDraw PRO | Total Quality ...
- Venn Diagram Examples for Problem Solving. Computer Science ...
- Business Process Modeling Tools | Workflow Process Example ...
- Network Gateway Router | Cisco Intelligent Services Gateway ...
- How to Draw an Organization Chart | How to Draw a Computer ...
- Types of Flowchart - Overview | Value stream with ConceptDraw ...