This site uses cookies. By continuing to browse the ConceptDraw site you are agreeing to our Use of Site Cookies.

Basic Flowchart Symbols and Meaning

Flowchart Symbols and Meaning - Provides a visual representation of basic flowchart symbols and their proposed use in professional workflow diagram, standard process flow diagram and communicating the structure of a well-developed web site, as well as their correlation in developing on-line instructional projects. See flowchart's symbols by specifics of process flow diagram symbols and workflow diagram symbols.
How to Build a Flowchart

Process Flowchart

ConceptDraw is Professional business process mapping software for making process flow diagram, workflow diagram, general flowcharts and technical illustrations for business documents. It is includes rich examples, templates, process flowchart symbols. ConceptDraw flowchart maker allows you to easier create a process flowchart. Use a variety of drawing tools, smart connectors, flowchart symbols and shape libraries to create flowcharts of complex processes, process flow diagrams, procedures and information exchange.
How To Create a Process Flow Chart (business process modelling techniques)
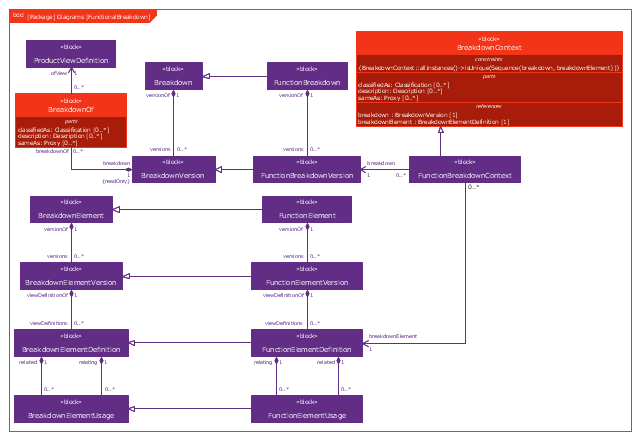
This example was drawn on the base of figure 1 on the webpage "Template: OASIS:FunctionalBreakdownStructure" from the OASIS website.
"The FunctionalBreakdownStructure template describes how to represent a relationship between a FunctionalElementDefinition and another FunctionalElementDefinition that is a constituent.
The SysML Block Definition diagram in Figure 1 shows how a functional breakdown is represented in the PLCS PSM."
[docs.oasis-open.org/ plcs/ plcslib/ v1.0/ csprd01/ data/ contexts/ OASIS/ templates/ FunctionalBreakdownStructure/ template.html]
"A block definition diagram is based on the UML class diagram, with restrictions and extensions as defined by SysML." [omg.org/ spec/ SysML/ 1.3/ PDF]
The example "SysML block definition diagram - Function Breakdown model" was drawn using the ConceptDraw PRO diagramming and vector drawing software extended with the SysML solution from the Software Development area of ConceptDraw Solution Park.
Example of SysML BDD
Example of SysML BDD, unit, part association, generalization, control operator frame, block definition diagram, block,

Venn Diagram Examples for Problem Solving. Venn Diagram as a Truth Table

Venn diagrams are illustrations used in the branch of mathematics known as set theory. They show the mathematical or logical relationship between different groups of things (sets). A Venn diagram shows all the possible logical relations between the sets.

Mathematical Diagrams

ConceptDraw PRO diagramming and vector drawing software extended with Mathematics solution from the Science and Education area is the best for creating: mathematical diagrams, graphics, tape diagrams various mathematical illustrations of any complexity quick and easy.
Mathematics solution provides 3 libraries: Plane Geometry Library, Solid Geometry Library, Trigonometric Functions Library.

Structured Systems Analysis and Design Method (SSADM) with ConceptDraw PRO

Structured Systems Analysis and Design Method SSADM is the method which is used at projecting and analysis of information systems. SSADM is based on the data flow diagrams. At the description of data flows out of the system and into the system DFD, which denote boundaries of the system, are used.
HelpDesk

Event-driven Process Chain (EPC) Diagram Software

An EPC diagram is a type of flowchart used in business process analysis. It shows different business processes through various work flows. The workflows are shown as processes and events that are related to different executes and tasks that allow business workflow to be completed.
An EPC diagram shows different business processes through various workflows. The workflows are seen as functions and events that are connected by different teams or people, as well as tasks that allow business processes to be executed. The best thing about this type of enterprise modelling is that creating an EPC diagram is quick and simple as long as you have the proper tool. One of the main usages of the EPC diagrams is in the modelling, analyzing and re-engineering of business processes. With the use of the flowchart, businesses are able to see inefficiencies in the processes and modify to make them more productive. Event-driven process chain diagrams are also used to configure an enterprise resource pla

Block Diagram

The vector stencils libraries: Block Diagrams, Blocks with Perspective, Callouts, Connectors, Raised Blocks from the solution Block Diagrams contain specific block diagram symbols such as arrows, input/output symbols, start/end symbols, processing symbols, conditional symbols, commenting symbols, callouts, connectors, etc. for ConceptDraw PRO diagramming and vector drawing software. The Block Diagrams solution is contained in a "Diagrams" area of ConceptDraw Solution Park.
Use the libraries from the Block Diagrams solution to draw block diagrams for your business documents, presentations and websites in a few minutes.

Data Flow Diagram

Data flow diagram (DFD) is the part of the SSADM method (Structured Systems Analysis and Design Methodology), intended for analysis and information systems projection. Data flow diagrams are intended for graphical representation of data flows in the information system and for analysis of data processing during the structural projection. Data flow diagram often used in connection with human process and can be displayed as workflow diagram. The critical Process Flow Diagram is another flowchart technique for designing data flow in connection with organizational processes. The critical Process flow diagram may use different range of symbols than a classic workflow diagram.

Program Structure Diagram

Program Structure Diagram - The Software Development solution from ConceptDraw Solution Park provides the stensils libraries of language level shapes and memory objects for drawing the structural diagrams of programs and memory objects using the ConceptDraw PRO diagramming and vector drawing software.

Functional Block Diagram

You need design the Functional Block Diagram and dream to find the useful tools to draw it easier, quickly and effectively? ConceptDraw PRO offers the Block Diagrams Solution from the "Diagrams" Area which will help you!

Personal area (PAN) networks. Computer and Network Examples

A Personal area network (PAN) is a computer network that is used for data transmission between different personal devices (computers, telephones, digital devices, etc.) and for connecting to the higher level network and Internet. PANs can be wired with computer buses (USB and FireWire). A wireless personal area network (WPAN) can be made using the network technologies such as Bluetooth, IrDa, UWB, Z-Wave, ZigBee, Body Area Network. A personal area network handles the interconnection of IT devices at the surrounding of a single user. Generally, PAN contains from following such appliances: cordless mice and keyboards, cordless phone, Bluetooth handsets.
This example was created in ConceptDraw PRO using the Computer and Networks Area of ConceptDraw Solution Park and shows the Personal area network.

ERD Symbols and Meanings

Crow's foot notation is used in Barker's Notation, Structured Systems Analysis and Design Method (SSADM) and information engineering. Crow's foot diagrams represent entities as boxes, and relationships as lines between the boxes. Different shapes at the ends of these lines represent the cardinality of the relationship.
The Chen's ERD notation is still used and is considered to present a more detailed way of representing entities and relationships.
To create an ERD, software engineers mainly turn to dedicated drawing software, which contain the full notation resources for their specific database design - ERD symbols and meanings. CS Odessa has released an all-inclusive Entity-Relationship Diagram (ERD) solution for their powerful drawing program, ConceptDraw PRO.
How to Build an Entity Relationship Diagram (ERD)

event-driven process chain diagram, EPC diagram, process chain flowchart Event-driven Process Chain Diagrams

event-driven process chain diagram, EPC diagram, process chain flowchart
Event-driven Process Chain (EPC) Diagram is a type of flowchart widely used for modeling in business engineering and reengineering, business process improvement, and analysis. EPC method was developed within the Architecture of Integrated Information Systems (ARIS) framework.

IDEF0 method, IDEF0 notation IDEF0 Diagrams

IDEF0 method, IDEF0 notation
IDEF0 Diagrams visualize system models using the Integration Definition for Function Modeling (IDEF) methodology. Use them for analysis, development and integration of information and software systems, and business process modelling.