This example was drawn on the base of figure 1 on the webpage "Template: OASIS:FunctionalBreakdownStructure" from the OASIS website.
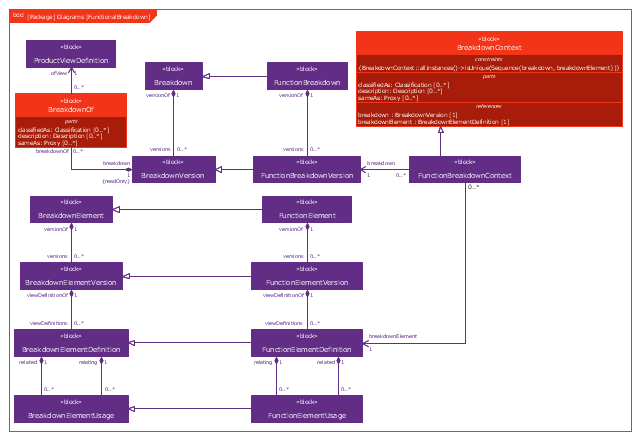
"The FunctionalBreakdownStructure template describes how to represent a relationship between a FunctionalElementDefinition and another FunctionalElementDefinition that is a constituent.
The SysML Block Definition diagram in Figure 1 shows how a functional breakdown is represented in the PLCS PSM."
[docs.oasis-open.org/ plcs/ plcslib/ v1.0/ csprd01/ data/ contexts/ OASIS/ templates/ FunctionalBreakdownStructure/ template.html]
"A block definition diagram is based on the UML class diagram, with restrictions and extensions as defined by SysML." [omg.org/ spec/ SysML/ 1.3/ PDF]
The example "SysML block definition diagram - Function Breakdown model" was drawn using the ConceptDraw PRO diagramming and vector drawing software extended with the SysML solution from the Software Development area of ConceptDraw Solution Park.
Example of SysML BDD
HelpDesk
Event-driven Process Chain (EPC) Diagram Software

 Mathematics
Mathematics solution extends ConceptDraw PRO software with templates, samples and libraries of vector stencils for drawing the mathematical illustrations, diagrams and charts.
 Event-driven Process Chain Diagrams
Event-driven Process Chain (EPC) Diagram is a type of flowchart widely used for modeling in business engineering and reengineering, business process improvement, and analysis. EPC method was developed within the Architecture of Integrated Information Systems (ARIS) framework.
 IDEF0 Diagrams
IDEF0 Diagrams visualize system models using the Integration Definition for Function Modeling (IDEF) methodology. Use them for analysis, development and integration of information and software systems, and business process modelling.
- Functional Diagram Example
- Function Model Diagram Template
- Functional Block Diagram
- IDEF0 standard with ConceptDraw PRO | IDEF0 Diagrams | IDEF0 ...
- Function Model Diagram Templates
- Business Function Diagram
- Function Block Diagram Examples
- Function Diagram
- Block Diagram | Functional Block Diagram | SysML block definition ...
- Block Diagram Of Function Organization Management
- UML Block Diagram | Block Diagrams | Block diagram - Automotive ...
- Business Function Process
- Flowchart Marketing Process. Flowchart Examples | Process ...
- Function Block
- Epc Diagram
- Diagram Function Of Industrial Management
- Property Maintenance Diagram Function Chat
- Function Mean Tree Example Flowchart
- MS Word Function Flowchart
- Deployment Chart Software | Deployment chart - Template | Quality ...