This site uses cookies. By continuing to browse the ConceptDraw site you are agreeing to our Use of Site Cookies.

Functional Block Diagram

You need design the Functional Block Diagram and dream to find the useful tools to draw it easier, quickly and effectively? ConceptDraw PRO offers the Block Diagrams Solution from the "Diagrams" Area which will help you!

Block Diagram

The vector stencils libraries: Block Diagrams, Blocks with Perspective, Callouts, Connectors, Raised Blocks from the solution Block Diagrams contain specific block diagram symbols such as arrows, input/output symbols, start/end symbols, processing symbols, conditional symbols, commenting symbols, callouts, connectors, etc. for ConceptDraw PRO diagramming and vector drawing software. The Block Diagrams solution is contained in a "Diagrams" area of ConceptDraw Solution Park.
Use the libraries from the Block Diagrams solution to draw block diagrams for your business documents, presentations and websites in a few minutes.

Functional Flow Block Diagram

You need to draw a Functional Flow Block Diagram? You are an artist? Now it doesn't matter. With Block Diagrams solution from the "Diagrams" area for ConceptDraw Solution Park you don't need more to be an artist to design the Functional Flow Block Diagram of any complexity.
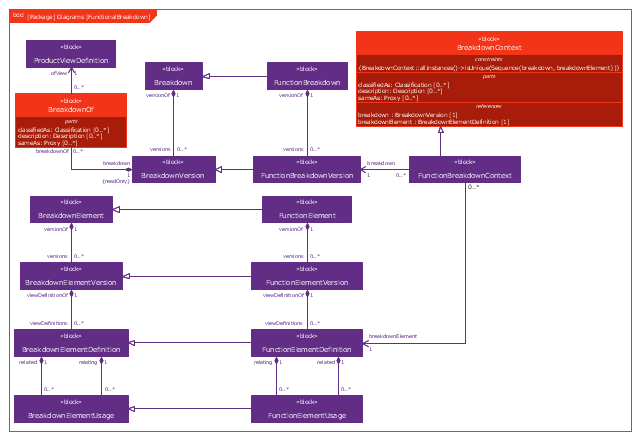
This example was drawn on the base of figure 1 on the webpage "Template: OASIS:FunctionalBreakdownStructure" from the OASIS website.
"The FunctionalBreakdownStructure template describes how to represent a relationship between a FunctionalElementDefinition and another FunctionalElementDefinition that is a constituent.
The SysML Block Definition diagram in Figure 1 shows how a functional breakdown is represented in the PLCS PSM."
[docs.oasis-open.org/ plcs/ plcslib/ v1.0/ csprd01/ data/ contexts/ OASIS/ templates/ FunctionalBreakdownStructure/ template.html]
"A block definition diagram is based on the UML class diagram, with restrictions and extensions as defined by SysML." [omg.org/ spec/ SysML/ 1.3/ PDF]
The example "SysML block definition diagram - Function Breakdown model" was drawn using the ConceptDraw PRO diagramming and vector drawing software extended with the SysML solution from the Software Development area of ConceptDraw Solution Park.
Example of SysML BDD
Example of SysML BDD, unit, part association, generalization, control operator frame, block definition diagram, block,

Block Diagram Creator

A block diagram is a diagram of a system in which the principal parts or functions are represented by blocks connected by lines that show the relationships of the blocks. ConceptDraw PRO diagramming and vector drawing software extended with Block Diagrams Solution from the "Diagrams" Area is a powerful Block Diagram Creator.

Process Flowchart

ConceptDraw is Professional business process mapping software for making process flow diagram, workflow diagram, general flowcharts and technical illustrations for business documents. It is includes rich examples, templates, process flowchart symbols. ConceptDraw flowchart maker allows you to easier create a process flowchart. Use a variety of drawing tools, smart connectors, flowchart symbols and shape libraries to create flowcharts of complex processes, process flow diagrams, procedures and information exchange.
How To Create a Process Flow Chart (business process modelling techniques)

Basic Flowchart Symbols and Meaning

Flowchart Symbols and Meaning - Provides a visual representation of basic flowchart symbols and their proposed use in professional workflow diagram, standard process flow diagram and communicating the structure of a well-developed web site, as well as their correlation in developing on-line instructional projects. See flowchart's symbols by specifics of process flow diagram symbols and workflow diagram symbols.
How to Build a Flowchart
HelpDesk

How to Draw a Block Diagram in ConceptDraw PRO

Block diagram is a simple chart that use blocks to show some elements or activities, and connectors that show the relationship between neighboring blocks. They are commonly simple, giving an overview of a process without necessarily going into the specifics of implementation. Block diagrams are commonly used to depict a general description of a system and its activity. A most known sample of a block diagram is a flow chart, used in many types of business as a common method of representing repeated processes. Easy and a simple creation, a number of objects and connectors make the block diagram a many-sided tool for various industries. The ability to make block diagrams is delivered by the ConceptDraw Block Diagrams solution.

Types of Flowcharts

A Flowchart is a graphically representation of the process, algorithm or the step-by-step solution of the problem. There are ten types of Flowcharts. Using the Flowcharts solution from the Diagrams area of ConceptDraw Solution Park you can easy and quickly design the Flowchart of any of these types.
How to Simplify Flow Charting

Cross-Functional Flowchart

Cross-Functional Flowchart - to draw cross functional process maps is by starting with a cross-functional flowchart samples and templates. Easy to draw sample cross functional Process Flow Diagrams. Using a Cross-Functional flowchart is a clear way of showing each team member’s responsibilities and how processes get shared or transferred between different teams and departments.
Use cross-functional flowcharts to show the relationship between a business process and the functional units (such as departments) responsible for that process. To create it use the best flowchart maker of ConceptDraw PRO.
How to Draw a Cross Functional Flowchart using visio alternative ConceptDraw PRO as visio for mac

Types of Flowchart - Overview

When designing a process or an instruction in clear way, you should consider creating a flowchart. A Process Flow Diagram is the method. You can avoid wasting a lot of time understanding complex concepts as they get clear with different diagrams.
How to Simplify Flow Charting

ConceptDraw Solution Park ConceptDraw Solution Park

ConceptDraw Solution Park
ConceptDraw Solution Park collects graphic extensions, examples and learning materials

Flowchart Software

Flowchart is widely used in business, education and economic presentations to help the audience visualize the content better, or to find flaws in a process flow diagrams. Flowcharts are particularly useful for displaying how a process currently flow or could ideally function. Flowcharts can help you see whether the steps of a process are logical, uncover problems or miscommunications, define the boundaries of a process, and develop a common base of knowledge about a process.

ConceptDraw PRO flowchart software will help to quickly create new flowcharts, workflow, NS Diagram, BPMN Diagram, Cross-functional flowcharts, data flow diagrams and highlight flowcharts.

Feature-rich flowchart maker, free thousand flowchart examples and templates and colored symbols that will allow you to create professional looking flowcharts simply.

ConceptDraw PRO supports macOS and Windows.
How to Build a Flowchart

IDEF3 Standard

Use Case Diagrams technology. IDEF3 Standard is intended for description and further analysis of technological processes of an enterprise. Using IDEF3 standard it is possible to examine and model scenarios of technological processes.