There is no commercial company in the world, that is not interested in attracting new customers. Any company strives to expand its business, to have a constant demand for its products and accordingly a stable income. The development, attraction new customers and retention existing ones are the main tasks of the business. But how to attract new customers? This question is relevant for recently opened business and for long existing. There are many ways and marketing strategies, among them are the study of demand in own field of production, qualified analysis of consumers' needs, creation of competitive and actual for this moment product, as well as the ability to present it skillfully on the market. In this regard it is impossible to dispense without the different promotional campaigns: advertising at Internet, in print editions, on billboards, various promotions, releases, promotional videos, trailers revealing plans, all they are effective methods to interest the customers and maintain this interest. The ability to correctly advertise the future improvements and updates plays an important role on the way to company's success.
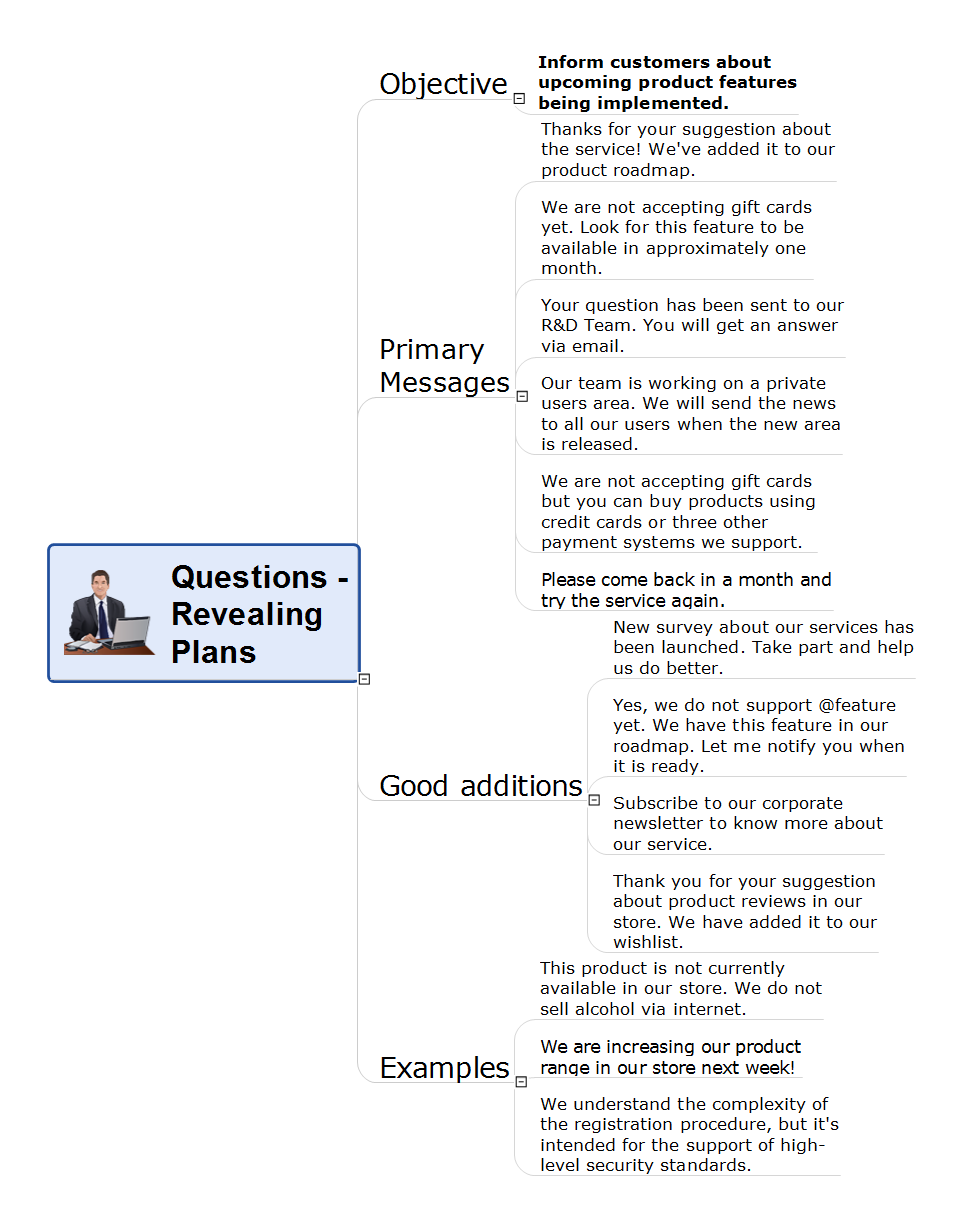
This action Mind Map created using the ConceptDraw MINDMAP tools helps to respond to customers questions related to the plans about future products or services of the company.